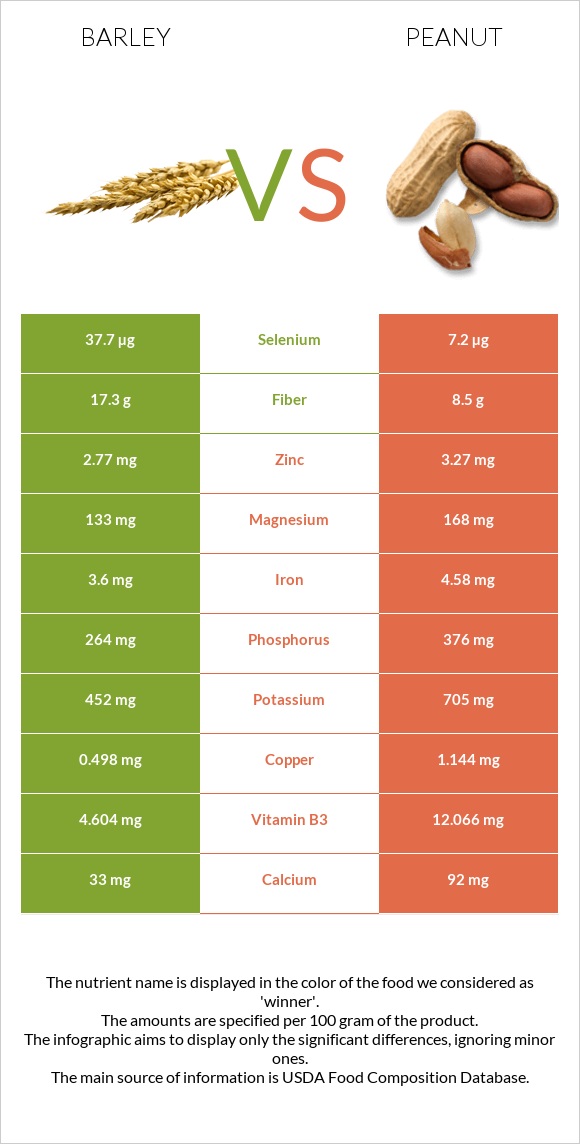
Differences between barley and peanuts Barley has more selenium and fiber, while peanuts have more copper, folate, vitamin E, vitamin B3, vitamin B5, phosphorus, and iron. Peanuts' daily need coverage for copper is 72% higher. Peanuts contain 5 times less selenium than barley. Barley contains 37.7µg of selenium, while peanuts contain 7.2µg. The amount of saturated fat in barley is lower. Peanuts have a lower glycemic index. The glycemic index of peanuts is 13, while the glycemic index of barley is 28. The food types used in this comparison are Barley, hulled and Peanuts, all types, raw .
Infographic
Mineral Comparison
Mineral comparison score is based on the number of minerals by which one or the other food is richer. The "coverage" charts below show how much of the daily needs can be covered by 300 grams of the food.
2
100 g
300 g
1 cup - 184g
Magnesium
Magnesium
Calcium
Calcium
Potassium
Potassium
Iron
Iron
Copper
Copper
Zinc
Zinc
Phosphorus
Phosphorus
Sodium
Sodium
Manganese
Manganese
Selenium
Selenium
95%
9.9%
40%
135%
166%
76%
113%
1.6%
253%
206%
7
100 g
300 g
1 oz - 28.35g 1 cup - 146g
Magnesium
Magnesium
Calcium
Calcium
Potassium
Potassium
Iron
Iron
Copper
Copper
Zinc
Zinc
Phosphorus
Phosphorus
Sodium
Sodium
Manganese
Manganese
Selenium
Selenium
120%
28%
62%
172%
381%
89%
161%
2.3%
252%
39%
Vitamin Comparison
Vitamin comparison score is based on the number of vitamins by which one or the other food is richer. The "coverage" charts below show how much of the daily needs can be covered by 300 grams of the food.
3
100 g
300 g
1 cup - 184g
Vitamin C
Vit. C
Vitamin D
Vit. D
Vitamin A
Vit. A
Vitamin E
Vit. E
Vitamin B1
Vit. B1
Vitamin B2
Vit. B2
Vitamin B3
Vit. B3
Vitamin B5
Vit. B5
Vitamin B6
Vit. B6
Vitamin B12
Vit. B12
Vitamin K
Vit. K
Folate
Folate
0%
0%
0.33%
11%
162%
66%
86%
17%
73%
0%
5.5%
14%
4
100 g
300 g
1 oz - 28.35g 1 cup - 146g
Vitamin C
Vit. C
Vitamin D
Vit. D
Vitamin A
Vit. A
Vitamin E
Vit. E
Vitamin B1
Vit. B1
Vitamin B2
Vit. B2
Vitamin B3
Vit. B3
Vitamin B5
Vit. B5
Vitamin B6
Vit. B6
Vitamin B12
Vit. B12
Vitamin K
Vit. K
Folate
Folate
0%
0%
0%
167%
160%
31%
226%
106%
80%
0%
0%
180%
All nutrients comparison - raw data values
Nutrient
DV% diff.
Polyunsaturated fat
1.108g
15.558g
96%
Fats
2.3g
49.24g
72%
Copper
0.498mg
1.144mg
72%
Monounsaturated fat
0.295g
24.426g
60%
Selenium
37.7µg
7.2µg
55%
Folate
19µg
240µg
55%
Vitamin E
0.57mg
8.33mg
52%
Vitamin B3
4.604mg
12.066mg
47%
Fiber
17.3g
8.5g
35%
Vitamin B5
0.282mg
1.767mg
30%
Protein
12.48g
25.8g
27%
Saturated fat
0.482g
6.279g
26%
Carbs
73.48g
16.13g
19%
Phosphorus
264mg
376mg
16%
Iron
3.6mg
4.58mg
12%
Vitamin B2
0.285mg
0.135mg
12%
Calories
354kcal
567kcal
11%
Choline
52.5mg
10%
Magnesium
133mg
168mg
8%
Potassium
452mg
705mg
7%
Calcium
33mg
92mg
6%
Zinc
2.77mg
3.27mg
5%
Vitamin B6
0.318mg
0.348mg
2%
Vitamin K
2.2µg
0µg
2%
Vitamin B1
0.646mg
0.64mg
1%
Protein per 100 calories
3.5g
4.6g
N/A
Calories per 10 g protein
284kcal
220kcal
N/A
Weight per 100 calories
28g
18g
N/A
Unsaturated / Saturated Fat ratio
2.9
6.4
N/A
Net carbs
56.18g
7.63g
N/A
Sugar
0.8g
4.72g
N/A
Sodium
12mg
18mg
0%
Vitamin A
1µg
0µg
0%
Manganese
1.943mg
1.934mg
0%
Tryptophan
0.208mg
0.25mg
0%
Threonine
0.424mg
0.883mg
0%
Isoleucine
0.456mg
0.907mg
0%
Leucine
0.848mg
1.672mg
0%
Lysine
0.465mg
0.926mg
0%
Methionine
0.24mg
0.317mg
0%
Phenylalanine
0.7mg
1.377mg
0%
Valine
0.612mg
1.082mg
0%
Histidine
0.281mg
0.652mg
0%
Macronutrient Comparison
Macronutrient breakdown side-by-side comparison
2
12%
2%
73%
9%
2%
Protein:
12.48 g
Fats:
2.3 g
Carbs:
73.48 g
Water:
9.44 g
Other:
2.3 g
3
26%
49%
16%
7%
2%
Protein:
25.8 g
Fats:
49.24 g
Carbs:
16.13 g
Water:
6.5 g
Other:
2.33 g
Contains
more
Carbs Carbs
+355.5%
Contains
more
Water Water
+45.2%
Contains
more
Protein Protein
+106.7%
Contains
more
Fats Fats
+2040.9%
Fat Type Comparison
Fat type breakdown side-by-side comparison
1
26%
16%
59%
Saturated fat:
Sat. Fat
0.482 g
Monounsaturated fat:
Mono. Fat
0.295 g
Polyunsaturated fat:
Poly. Fat
1.108 g
2
14%
53%
34%
Saturated fat:
Sat. Fat
6.279 g
Monounsaturated fat:
Mono. Fat
24.426 g
Polyunsaturated fat:
Poly. Fat
15.558 g
Contains
less
Sat. Fat Saturated fat
-92.3%
Contains
more
Mono. Fat Monounsaturated fat
+8180%
Contains
more
Poly. Fat Polyunsaturated fat
+1304.2%