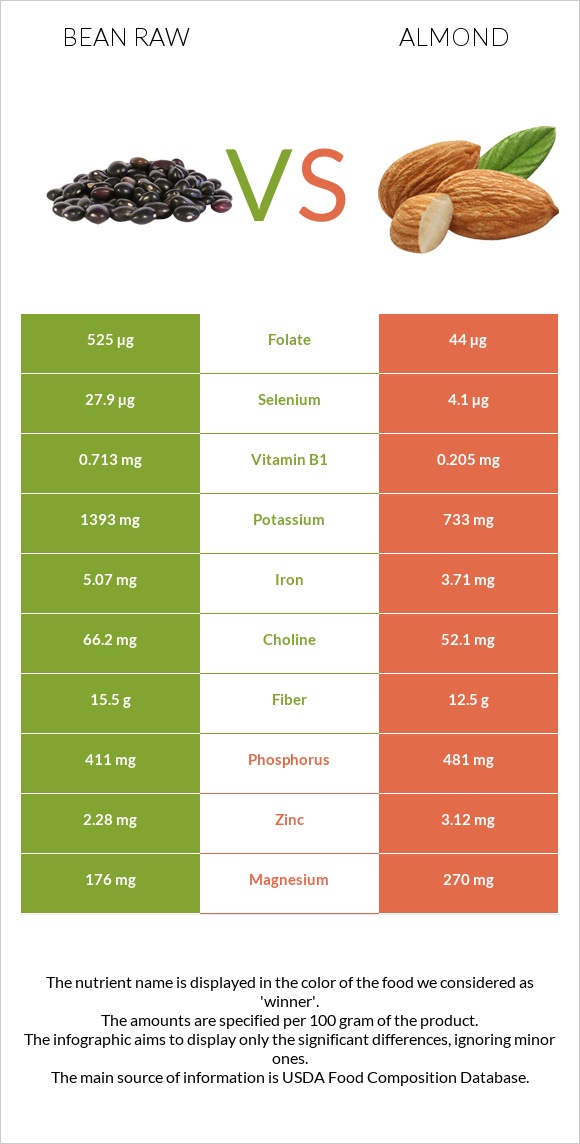
Summary of differences between bean raw and almonds Bean raw has more folate, selenium, vitamin B1, vitamin B6, and potassium, while almonds have more vitamin E, vitamin B2, manganese, and magnesium. Almonds cover your daily need for vitamin E, 169% more than bean raw. Bean raw contains 12 times more folate than almonds. While bean raw contains 525µg of folate, almonds contain only 44µg. The amount of saturated fat in bean raw is lower. Almonds have a lower glycemic index. The glycemic index of almonds is 0, while the glycemic index of bean raw is 33. These are the specific foods used in this comparison Beans, pinto, mature seeds, raw and Nuts, almonds .
Infographic
Mineral Comparison
Mineral comparison score is based on the number of minerals by which one or the other food is richer. The "coverage" charts below show how much of the daily needs can be covered by 300 grams of the food.
3
100 g
300 g
1 tbsp - 12g 1 cup - 193g
Magnesium
Magnesium
Calcium
Calcium
Potassium
Potassium
Iron
Iron
Copper
Copper
Zinc
Zinc
Phosphorus
Phosphorus
Sodium
Sodium
Manganese
Manganese
Selenium
Selenium
126%
34%
123%
190%
298%
62%
176%
1.6%
150%
152%
7
100 g
300 g
1 almond - 1.2g 1 oz (23 whole kernels) - 28.35g 1 cup, sliced - 92g 1 cup, ground - 95g 1 cup, slivered - 108g 1 cup, whole - 143g
Magnesium
Magnesium
Calcium
Calcium
Potassium
Potassium
Iron
Iron
Copper
Copper
Zinc
Zinc
Phosphorus
Phosphorus
Sodium
Sodium
Manganese
Manganese
Selenium
Selenium
193%
81%
65%
139%
344%
85%
206%
0.13%
284%
22%
Vitamin Comparison
Vitamin comparison score is based on the number of vitamins by which one or the other food is richer. The "coverage" charts below show how much of the daily needs can be covered by 300 grams of the food.
6
100 g
300 g
1 tbsp - 12g 1 cup - 193g
Vitamin C
Vit. C
Vitamin D
Vit. D
Vitamin A
Vit. A
Vitamin E
Vit. E
Vitamin B1
Vit. B1
Vitamin B2
Vit. B2
Vitamin B3
Vit. B3
Vitamin B5
Vit. B5
Vitamin B6
Vit. B6
Vitamin B12
Vit. B12
Vitamin K
Vit. K
Folate
Folate
21%
0%
0%
4.2%
178%
49%
22%
47%
109%
0%
14%
394%
3
100 g
300 g
1 almond - 1.2g 1 oz (23 whole kernels) - 28.35g 1 cup, sliced - 92g 1 cup, ground - 95g 1 cup, slivered - 108g 1 cup, whole - 143g
Vitamin C
Vit. C
Vitamin D
Vit. D
Vitamin A
Vit. A
Vitamin E
Vit. E
Vitamin B1
Vit. B1
Vitamin B2
Vit. B2
Vitamin B3
Vit. B3
Vitamin B5
Vit. B5
Vitamin B6
Vit. B6
Vitamin B12
Vit. B12
Vitamin K
Vit. K
Folate
Folate
0%
0%
0%
513%
51%
263%
68%
28%
32%
0%
0%
33%
All nutrients comparison - raw data values
Nutrient
DV% diff.
Vitamin E
0.21mg
25.63mg
169%
Folate
525µg
44µg
120%
Polyunsaturated fat
0.407g
12.329g
79%
Monounsaturated fat
0.229g
31.551g
78%
Fats
1.23g
49.93g
75%
Vitamin B2
0.212mg
1.138mg
71%
Manganese
1.148mg
2.179mg
45%
Selenium
27.9µg
4.1µg
43%
Vitamin B1
0.713mg
0.205mg
42%
Vitamin B6
0.474mg
0.137mg
26%
Magnesium
176mg
270mg
22%
Potassium
1393mg
733mg
19%
Iron
5.07mg
3.71mg
17%
Calcium
113mg
269mg
16%
Saturated fat
0.235g
3.802g
16%
Copper
0.893mg
1.031mg
15%
Vitamin B3
1.174mg
3.618mg
15%
Carbs
62.55g
21.55g
14%
Starch
34.17g
0.72g
14%
Calories
347kcal
579kcal
12%
Fiber
15.5g
12.5g
12%
Phosphorus
411mg
481mg
10%
Zinc
2.28mg
3.12mg
8%
Vitamin C
6.3mg
0mg
7%
Vitamin B5
0.785mg
0.471mg
6%
Vitamin K
5.6µg
0µg
5%
Choline
66.2mg
52.1mg
3%
Protein
21.42g
21.15g
1%
Protein per 100 calories
6.2g
3.7g
N/A
Calories per 10 g protein
162kcal
274kcal
N/A
Weight per 100 calories
29g
17g
N/A
Unsaturated / Saturated Fat ratio
2.7
12
N/A
Net carbs
47.05g
9.05g
N/A
Sugar
2.11g
4.35g
N/A
Sodium
12mg
1mg
0%
Trans fat
0g
0.015g
N/A
Tryptophan
0.237mg
0.211mg
0%
Threonine
0.81mg
0.601mg
0%
Isoleucine
0.871mg
0.751mg
0%
Leucine
1.558mg
1.473mg
0%
Lysine
1.356mg
0.568mg
0%
Methionine
0.259mg
0.157mg
0%
Phenylalanine
1.095mg
1.132mg
0%
Valine
0.998mg
0.855mg
0%
Histidine
0.556mg
0.539mg
0%
Fructose
0g
0.11g
0%
Omega-3 - ALA
0.003g
N/A
Omega-6 - Eicosadienoic acid
0.002g
N/A
Omega-6 - Linoleic acid
12.32g
N/A
Macronutrient Comparison
Macronutrient breakdown side-by-side comparison
4
21%
63%
11%
3%
Protein:
21.42 g
Fats:
1.23 g
Carbs:
62.55 g
Water:
11.33 g
Other:
3.47 g
1
21%
50%
22%
4%
3%
Protein:
21.15 g
Fats:
49.93 g
Carbs:
21.55 g
Water:
4.41 g
Other:
2.96 g
Contains
more
Carbs Carbs
+190.3%
Contains
more
Water Water
+156.9%
Contains
more
Other Other
+17.2%
Contains
more
Fats Fats
+3959.3%
~equal in
Protein
~21.15g
Fat Type Comparison
Fat type breakdown side-by-side comparison
1
27%
26%
47%
Saturated fat:
Sat. Fat
0.235 g
Monounsaturated fat:
Mono. Fat
0.229 g
Polyunsaturated fat:
Poly. Fat
0.407 g
2
8%
66%
26%
Saturated fat:
Sat. Fat
3.802 g
Monounsaturated fat:
Mono. Fat
31.551 g
Polyunsaturated fat:
Poly. Fat
12.329 g
Contains
less
Sat. Fat Saturated fat
-93.8%
Contains
more
Mono. Fat Monounsaturated fat
+13677.7%
Contains
more
Poly. Fat Polyunsaturated fat
+2929.2%
Carbohydrate type comparison
Carbohydrate type breakdown side-by-side comparison
1
94%
5%
Starch:
34.17 g
Sucrose:
1.98 g
Glucose:
0.13 g
Fructose:
0 g
Lactose:
0 g
Maltose:
0 g
Galactose:
0 g
5
14%
78%
3%
2%
Starch:
0.72 g
Sucrose:
3.95 g
Glucose:
0.17 g
Fructose:
0.11 g
Lactose:
0 g
Maltose:
0.04 g
Galactose:
0.07 g
Contains
more
Starch Starch
+4645.8%
Contains
more
Sucrose Sucrose
+99.5%
Contains
more
Glucose Glucose
+30.8%
Contains
more
Fructose Fructose
+∞%
Contains
more
Maltose Maltose
+∞%
Contains
more
Galactose Galactose
+∞%