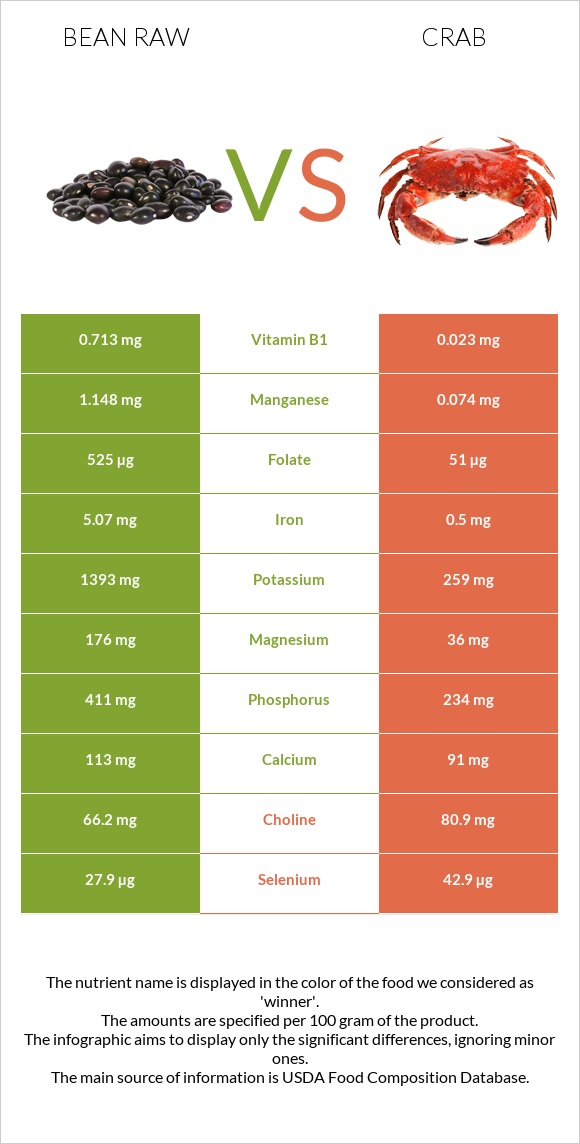
Summary of differences between bean raw and crab Bean raw has more folate, fiber, vitamin B1, iron, manganese, potassium, and magnesium, while crab has more vitamin B12 and selenium. Crab covers your daily need for vitamin B12, 139% more than bean raw. Crab has a lower glycemic index. The glycemic index of crab is 0, while the glycemic index of bean raw is 33. These are the specific foods used in this comparison Beans, pinto, mature seeds, raw and Crustaceans, crab, blue, canned .
Infographic
Mineral Comparison
Mineral comparison score is based on the number of minerals by which one or the other food is richer. The "coverage" charts below show how much of the daily needs can be covered by 300 grams of the food.
7
100 g
300 g
1 tbsp - 12g 1 cup - 193g
Magnesium
Magnesium
Calcium
Calcium
Potassium
Potassium
Iron
Iron
Copper
Copper
Zinc
Zinc
Phosphorus
Phosphorus
Sodium
Sodium
Manganese
Manganese
Selenium
Selenium
126%
34%
123%
190%
298%
62%
176%
1.6%
150%
152%
2
100 g
300 g
1 oz - 28.35g 3 oz - 85g 1 can (6.5 oz), drained - 125g 1 cup - 135g
Magnesium
Magnesium
Calcium
Calcium
Potassium
Potassium
Iron
Iron
Copper
Copper
Zinc
Zinc
Phosphorus
Phosphorus
Sodium
Sodium
Manganese
Manganese
Selenium
Selenium
26%
27%
23%
19%
271%
104%
100%
73%
9.7%
234%
Vitamin Comparison
Vitamin comparison score is based on the number of vitamins by which one or the other food is richer. The "coverage" charts below show how much of the daily needs can be covered by 300 grams of the food.
6
100 g
300 g
1 tbsp - 12g 1 cup - 193g
Vitamin C
Vit. C
Vitamin D
Vit. D
Vitamin A
Vit. A
Vitamin E
Vit. E
Vitamin B1
Vit. B1
Vitamin B2
Vit. B2
Vitamin B3
Vit. B3
Vitamin B5
Vit. B5
Vitamin B6
Vit. B6
Vitamin B12
Vit. B12
Vitamin K
Vit. K
Folate
Folate
21%
0%
0%
4.2%
178%
49%
22%
47%
109%
0%
14%
394%
5
100 g
300 g
1 oz - 28.35g 3 oz - 85g 1 can (6.5 oz), drained - 125g 1 cup - 135g
Vitamin C
Vit. C
Vitamin D
Vit. D
Vitamin A
Vit. A
Vitamin E
Vit. E
Vitamin B1
Vit. B1
Vitamin B2
Vit. B2
Vitamin B3
Vit. B3
Vitamin B5
Vit. B5
Vitamin B6
Vit. B6
Vitamin B12
Vit. B12
Vitamin K
Vit. K
Folate
Folate
11%
0%
0.33%
37%
5.8%
21%
52%
60%
36%
416%
0.75%
38%
All nutrients comparison - raw data values
Nutrient
DV% diff.
Vitamin B12
0µg
3.33µg
139%
Folate
525µg
51µg
119%
Fiber
15.5g
0g
62%
Vitamin B1
0.713mg
0.023mg
58%
Iron
5.07mg
0.5mg
57%
Manganese
1.148mg
0.074mg
47%
Magnesium
176mg
36mg
33%
Potassium
1393mg
259mg
33%
Cholesterol
0mg
97mg
32%
Selenium
27.9µg
42.9µg
27%
Phosphorus
411mg
234mg
25%
Sodium
12mg
563mg
24%
Vitamin B6
0.474mg
0.156mg
24%
Carbs
62.55g
0g
21%
Zinc
2.28mg
3.81mg
14%
Starch
34.17g
0g
14%
Calories
347kcal
83kcal
13%
Vitamin E
0.21mg
1.84mg
11%
Vitamin B3
1.174mg
2.747mg
10%
Copper
0.893mg
0.814mg
9%
Vitamin B2
0.212mg
0.093mg
9%
Protein
21.42g
17.88g
7%
Vitamin B5
0.785mg
0.997mg
4%
Vitamin K
5.6µg
0.3µg
4%
Vitamin C
6.3mg
3.3mg
3%
Choline
66.2mg
80.9mg
3%
Calcium
113mg
91mg
2%
Fats
1.23g
0.74g
1%
Polyunsaturated fat
0.407g
0.258g
1%
Protein per 100 calories
6.2g
22g
N/A
Calories per 10 g protein
162kcal
46kcal
N/A
Weight per 100 calories
29g
120g
N/A
Net carbs
47.05g
0g
N/A
Sugar
2.11g
0g
N/A
Vitamin A
0µg
1µg
0%
Trans fat
0g
0.014g
N/A
Saturated fat
0.235g
0.201g
0%
Monounsaturated fat
0.229g
0.129g
0%
Tryptophan
0.237mg
0.226mg
0%
Threonine
0.81mg
0.727mg
0%
Isoleucine
0.871mg
0.776mg
0%
Leucine
1.558mg
1.307mg
0%
Lysine
1.356mg
1.386mg
0%
Methionine
0.259mg
0.452mg
0%
Phenylalanine
1.095mg
0.708mg
0%
Valine
0.998mg
0.806mg
0%
Histidine
0.556mg
0.393mg
0%
Omega-3 - EPA
0g
0.101g
N/A
Omega-3 - DHA
0g
0.067g
N/A
Omega-3 - DPA
0g
0.009g
N/A
Omega-6 - Eicosadienoic acid
0.005g
N/A
Macronutrient Comparison
Macronutrient breakdown side-by-side comparison
4
21%
63%
11%
3%
Protein:
21.42 g
Fats:
1.23 g
Carbs:
62.55 g
Water:
11.33 g
Other:
3.47 g
1
18%
80%
2%
Protein:
17.88 g
Fats:
0.74 g
Carbs:
0 g
Water:
79.69 g
Other:
1.69 g
Contains
more
Protein Protein
+19.8%
Contains
more
Fats Fats
+66.2%
Contains
more
Carbs Carbs
+∞%
Contains
more
Other Other
+105.3%
Contains
more
Water Water
+603.4%
Fat Type Comparison
Fat type breakdown side-by-side comparison
2
27%
26%
47%
Saturated fat:
Sat. Fat
0.235 g
Monounsaturated fat:
Mono. Fat
0.229 g
Polyunsaturated fat:
Poly. Fat
0.407 g
1
34%
22%
44%
Saturated fat:
Sat. Fat
0.201 g
Monounsaturated fat:
Mono. Fat
0.129 g
Polyunsaturated fat:
Poly. Fat
0.258 g
Contains
more
Mono. Fat Monounsaturated fat
+77.5%
Contains
more
Poly. Fat Polyunsaturated fat
+57.8%
Contains
less
Sat. Fat Saturated fat
-14.5%