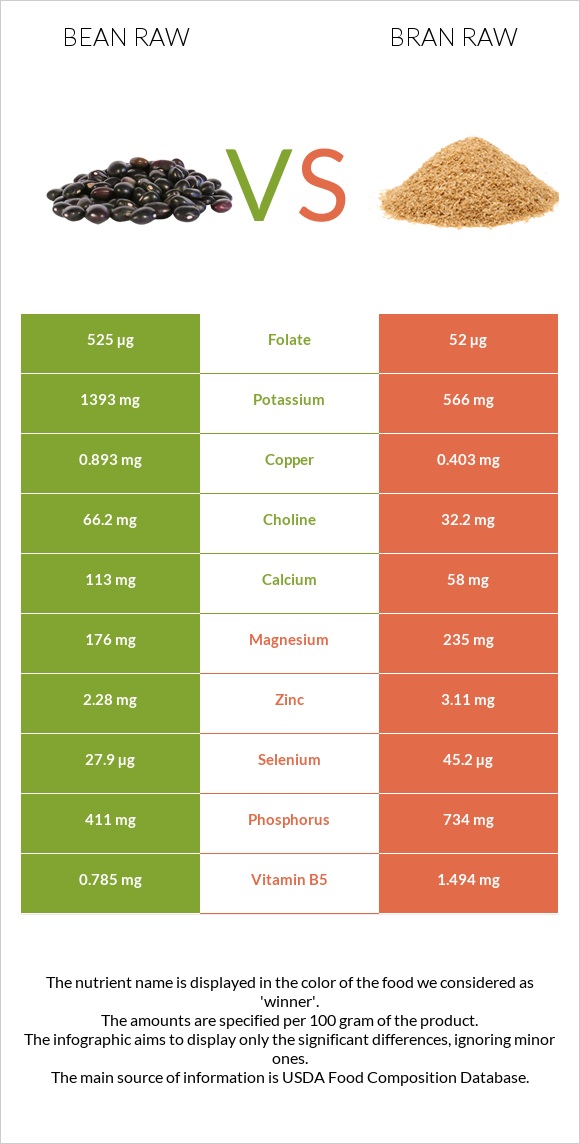
A recap on the differences between bean raw and bran raw Bean raw has more folate, copper, potassium, and vitamin B6; however, bran raw is higher in manganese, phosphorus, vitamin B1, selenium, vitamin B5, and magnesium. Bran raw covers your daily manganese needs 195% more than bean raw. Bran raw contains 10 times less folate than bean raw. Bean raw contains 525µg of folate, while bran raw contains 52µg. The glycemic index of bran raw is higher. Food varieties used in this article are Beans, pinto, mature seeds, raw and Oat bran, raw .
Infographic
Mineral Comparison
Mineral comparison score is based on the number of minerals by which one or the other food is richer. The "coverage" charts below show how much of the daily needs can be covered by 300 grams of the food.
3
100 g
300 g
1 tbsp - 12g 1 cup - 193g
Magnesium
Magnesium
Calcium
Calcium
Potassium
Potassium
Iron
Iron
Copper
Copper
Zinc
Zinc
Phosphorus
Phosphorus
Sodium
Sodium
Manganese
Manganese
Selenium
Selenium
126%
34%
123%
190%
298%
62%
176%
1.6%
150%
152%
6
100 g
300 g
1 cup - 94g
Magnesium
Magnesium
Calcium
Calcium
Potassium
Potassium
Iron
Iron
Copper
Copper
Zinc
Zinc
Phosphorus
Phosphorus
Sodium
Sodium
Manganese
Manganese
Selenium
Selenium
168%
17%
50%
203%
134%
85%
315%
0.52%
734%
247%
Vitamin Comparison
Vitamin comparison score is based on the number of vitamins by which one or the other food is richer. The "coverage" charts below show how much of the daily needs can be covered by 300 grams of the food.
5
100 g
300 g
1 tbsp - 12g 1 cup - 193g
Vitamin C
Vit. C
Vitamin D
Vit. D
Vitamin A
Vit. A
Vitamin E
Vit. E
Vitamin B1
Vit. B1
Vitamin B2
Vit. B2
Vitamin B3
Vit. B3
Vitamin B5
Vit. B5
Vitamin B6
Vit. B6
Vitamin B12
Vit. B12
Vitamin K
Vit. K
Folate
Folate
21%
0%
0%
4.2%
178%
49%
22%
47%
109%
0%
14%
394%
3
100 g
300 g
1 cup - 94g
Vitamin C
Vit. C
Vitamin D
Vit. D
Vitamin A
Vit. A
Vitamin E
Vit. E
Vitamin B1
Vit. B1
Vitamin B2
Vit. B2
Vitamin B3
Vit. B3
Vitamin B5
Vit. B5
Vitamin B6
Vit. B6
Vitamin B12
Vit. B12
Vitamin K
Vit. K
Folate
Folate
0%
0%
0%
20%
293%
51%
18%
90%
38%
0%
8%
39%
All nutrients comparison - raw data values
Nutrient
DV% diff.
Manganese
1.148mg
5.63mg
195%
Folate
525µg
52µg
118%
Copper
0.893mg
0.403mg
54%
Phosphorus
411mg
734mg
46%
Vitamin B1
0.713mg
1.17mg
38%
Selenium
27.9µg
45.2µg
31%
Potassium
1393mg
566mg
24%
Vitamin B6
0.474mg
0.165mg
24%
Polyunsaturated fat
0.407g
2.766g
16%
Magnesium
176mg
235mg
14%
Starch
34.17g
14%
Vitamin B5
0.785mg
1.494mg
14%
Fats
1.23g
7.03g
9%
Protein
21.42g
17.3g
8%
Zinc
2.28mg
3.11mg
8%
Vitamin C
6.3mg
0mg
7%
Calcium
113mg
58mg
6%
Choline
66.2mg
32.2mg
6%
Calories
347kcal
246kcal
5%
Vitamin E
0.21mg
1.01mg
5%
Saturated fat
0.235g
1.328g
5%
Monounsaturated fat
0.229g
2.376g
5%
Iron
5.07mg
5.41mg
4%
Vitamin B3
1.174mg
0.934mg
2%
Vitamin K
5.6µg
3.2µg
2%
Carbs
62.55g
66.22g
1%
Vitamin B2
0.212mg
0.22mg
1%
Protein per 100 calories
6.2g
7g
N/A
Calories per 10 g protein
162kcal
142kcal
N/A
Weight per 100 calories
29g
41g
N/A
Unsaturated / Saturated Fat ratio
2.7
3.9
N/A
Net carbs
47.05g
50.82g
N/A
Sugar
2.11g
1.45g
N/A
Fiber
15.5g
15.4g
0%
Sodium
12mg
4mg
0%
Tryptophan
0.237mg
0.335mg
0%
Threonine
0.81mg
0.502mg
0%
Isoleucine
0.871mg
0.668mg
0%
Leucine
1.558mg
1.374mg
0%
Lysine
1.356mg
0.76mg
0%
Methionine
0.259mg
0.335mg
0%
Phenylalanine
1.095mg
0.908mg
0%
Valine
0.998mg
0.964mg
0%
Histidine
0.556mg
0.41mg
0%
Macronutrient Comparison
Macronutrient breakdown side-by-side comparison
3
21%
63%
11%
3%
Protein:
21.42 g
Fats:
1.23 g
Carbs:
62.55 g
Water:
11.33 g
Other:
3.47 g
2
17%
7%
66%
7%
3%
Protein:
17.3 g
Fats:
7.03 g
Carbs:
66.22 g
Water:
6.55 g
Other:
2.9 g
Contains
more
Protein Protein
+23.8%
Contains
more
Water Water
+73%
Contains
more
Other Other
+19.7%
Contains
more
Fats Fats
+471.5%
Fat Type Comparison
Fat type breakdown side-by-side comparison
1
27%
26%
47%
Saturated fat:
Sat. Fat
0.235 g
Monounsaturated fat:
Mono. Fat
0.229 g
Polyunsaturated fat:
Poly. Fat
0.407 g
2
21%
37%
43%
Saturated fat:
Sat. Fat
1.328 g
Monounsaturated fat:
Mono. Fat
2.376 g
Polyunsaturated fat:
Poly. Fat
2.766 g
Contains
less
Sat. Fat Saturated fat
-82.3%
Contains
more
Mono. Fat Monounsaturated fat
+937.6%
Contains
more
Poly. Fat Polyunsaturated fat
+579.6%