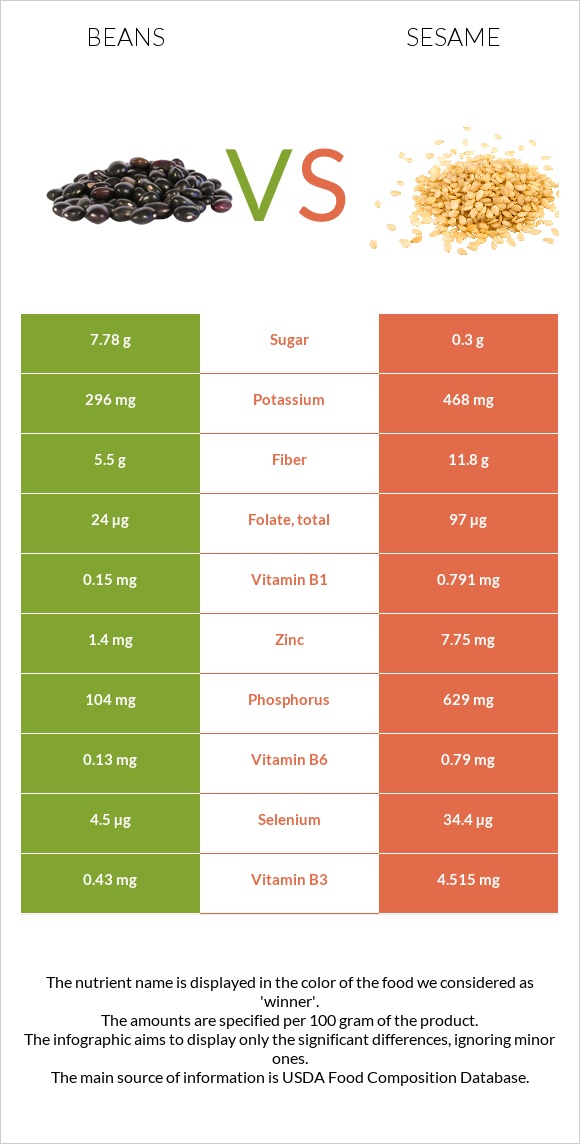
Important differences between beans and sesame Beans have less copper, iron, calcium, magnesium, phosphorus, zinc, selenium, vitamin B1, and vitamin B6. Sesame's daily need coverage for copper is 431% more. Beans are lower in saturated fat. The food varieties used in the comparison are Beans, baked, canned, no salt added and Seeds, sesame seeds, whole, dried .
Infographic
Mineral Comparison
Mineral comparison score is based on the number of minerals by which one or the other food is richer. The "coverage" charts below show how much of the daily needs can be covered by 300 grams of the food.
1
100 g
300 g
1 cup - 253g
Magnesium
Magnesium
Calcium
Calcium
Potassium
Potassium
Iron
Iron
Copper
Copper
Zinc
Zinc
Phosphorus
Phosphorus
Sodium
Sodium
Manganese
Manganese
Selenium
Selenium
23%
15%
26%
11%
69%
38%
45%
0.13%
0%
25%
9
100 g
300 g
1 tbsp - 9g 1 cup - 144g
Magnesium
Magnesium
Calcium
Calcium
Potassium
Potassium
Iron
Iron
Copper
Copper
Zinc
Zinc
Phosphorus
Phosphorus
Sodium
Sodium
Manganese
Manganese
Selenium
Selenium
251%
293%
41%
546%
1361%
211%
270%
1.4%
321%
188%
Vitamin Comparison
Vitamin comparison score is based on the number of vitamins by which one or the other food is richer. The "coverage" charts below show how much of the daily needs can be covered by 300 grams of the food.
3
100 g
300 g
1 cup - 253g
Vitamin C
Vit. C
Vitamin D
Vit. D
Vitamin A
Vit. A
Vitamin E
Vit. E
Vitamin B1
Vit. B1
Vitamin B2
Vit. B2
Vitamin B3
Vit. B3
Vitamin B5
Vit. B5
Vitamin B6
Vit. B6
Vitamin B12
Vit. B12
Vitamin K
Vit. K
Folate
Folate
10%
0%
1.7%
3%
38%
14%
8.1%
0%
30%
0%
2%
18%
7
100 g
300 g
1 tbsp - 9g 1 cup - 144g
Vitamin C
Vit. C
Vitamin D
Vit. D
Vitamin A
Vit. A
Vitamin E
Vit. E
Vitamin B1
Vit. B1
Vitamin B2
Vit. B2
Vitamin B3
Vit. B3
Vitamin B5
Vit. B5
Vitamin B6
Vit. B6
Vitamin B12
Vit. B12
Vitamin K
Vit. K
Folate
Folate
0%
0%
0%
5%
198%
57%
85%
3%
182%
0%
0%
73%
All nutrients comparison - raw data values
Nutrient
DV% diff.
Copper
0.206mg
4.082mg
431%
Iron
0.29mg
14.55mg
178%
Polyunsaturated fat
0.172g
21.773g
144%
Manganese
2.46mg
107%
Calcium
50mg
975mg
93%
Fats
0.4g
49.67g
76%
Magnesium
32mg
351mg
76%
Phosphorus
104mg
629mg
75%
Zinc
1.4mg
7.75mg
58%
Selenium
4.5µg
34.4µg
54%
Vitamin B1
0.15mg
0.791mg
53%
Vitamin B6
0.13mg
0.79mg
51%
Monounsaturated fat
0.035g
18.759g
47%
Saturated fat
0.103g
6.957g
31%
Protein
4.8g
17.73g
26%
Vitamin B3
0.43mg
4.515mg
26%
Fiber
5.5g
11.8g
25%
Calories
105kcal
573kcal
23%
Folate
24µg
97µg
18%
Vitamin B2
0.06mg
0.247mg
14%
Potassium
296mg
468mg
5%
Vitamin C
3.1mg
0mg
3%
Carbs
20.49g
23.45g
1%
Vitamin A
5µg
0µg
1%
Vitamin E
0.15mg
0.25mg
1%
Vitamin B5
0.05mg
1%
Vitamin K
0.8µg
0µg
1%
Choline
30.8mg
25.6mg
1%
Protein per 100 calories
4.6g
3.1g
N/A
Calories per 10 g protein
219kcal
323kcal
N/A
Weight per 100 calories
95g
17g
N/A
Unsaturated / Saturated Fat ratio
2
5.8
N/A
Net carbs
14.99g
11.65g
N/A
Sugar
7.78g
0.3g
N/A
Sodium
1mg
11mg
0%
Tryptophan
0.388mg
0%
Threonine
0.736mg
0%
Isoleucine
0.763mg
0%
Leucine
1.358mg
0%
Lysine
0.569mg
0%
Methionine
0.586mg
0%
Phenylalanine
0.94mg
0%
Valine
0.99mg
0%
Histidine
0.522mg
0%
Macronutrient Comparison
Macronutrient breakdown side-by-side comparison
1
5%
20%
73%
2%
Protein:
4.8 g
Fats:
0.4 g
Carbs:
20.49 g
Water:
72.6 g
Other:
1.71 g
4
18%
50%
23%
5%
4%
Protein:
17.73 g
Fats:
49.67 g
Carbs:
23.45 g
Water:
4.69 g
Other:
4.46 g
Contains
more
Water Water
+1448%
Contains
more
Protein Protein
+269.4%
Contains
more
Fats Fats
+12317.5%
Contains
more
Carbs Carbs
+14.4%
Contains
more
Other Other
+160.8%
Fat Type Comparison
Fat type breakdown side-by-side comparison
1
33%
11%
55%
Saturated fat:
Sat. Fat
0.103 g
Monounsaturated fat:
Mono. Fat
0.035 g
Polyunsaturated fat:
Poly. Fat
0.172 g
2
15%
40%
46%
Saturated fat:
Sat. Fat
6.957 g
Monounsaturated fat:
Mono. Fat
18.759 g
Polyunsaturated fat:
Poly. Fat
21.773 g
Contains
less
Sat. Fat Saturated fat
-98.5%
Contains
more
Mono. Fat Monounsaturated fat
+53497.1%
Contains
more
Poly. Fat Polyunsaturated fat
+12558.7%