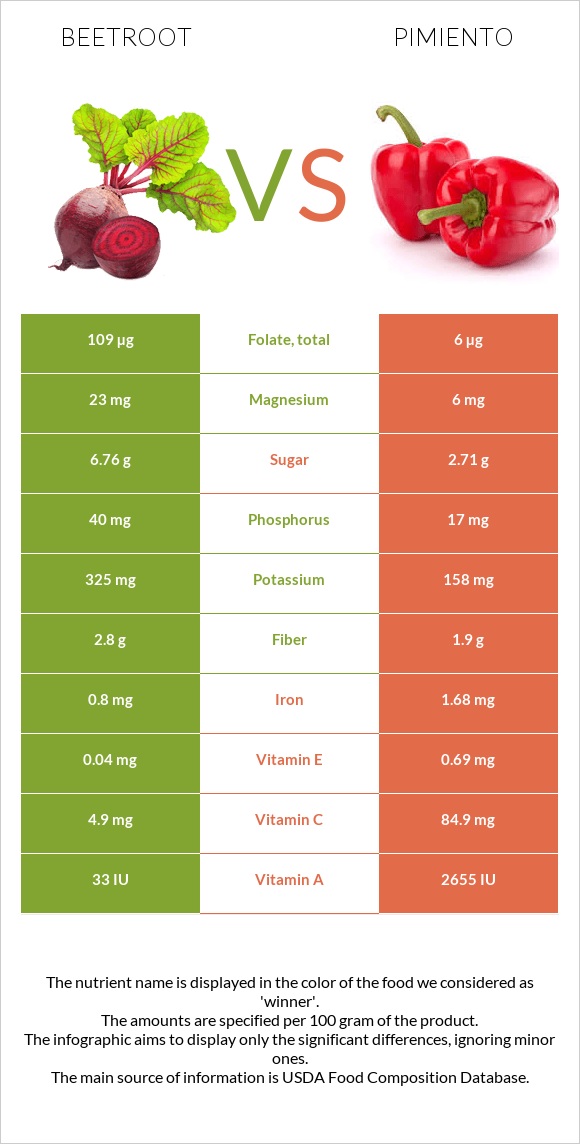
Summary of differences between beetroot and pimiento Beetroot has more folate and manganese, while pimiento has more vitamin C, vitamin A, vitamin B6, iron, and vitamin K. Pimiento covers your daily need for vitamin C, 89% more than beetroot. Beetroot contains 18 times more folate than pimiento. While beetroot contains 109µg of folate, pimiento contains only 6µg. Pimiento has a lower glycemic index. The glycemic index of pimiento is 45, while the glycemic index of beetroot is 64. These are the specific foods used in this comparison Beets, raw and Pimento, canned .
Infographic
Mineral Comparison
Mineral comparison score is based on the number of minerals by which one or the other food is richer. The "coverage" charts below show how much of the daily needs can be covered by 300 grams of the food.
8
100 g
300 g
1 beet (2" dia) - 82g 1 cup - 136g
Magnesium
Magnesium
Calcium
Calcium
Potassium
Potassium
Iron
Iron
Copper
Copper
Zinc
Zinc
Phosphorus
Phosphorus
Sodium
Sodium
Manganese
Manganese
Selenium
Selenium
16%
4.8%
29%
30%
25%
9.5%
17%
10%
43%
3.8%
2
100 g
300 g
1 slice - 1g 1 tbsp - 12g 1 pimiento, whole - 66g 1 cup - 192g
Magnesium
Magnesium
Calcium
Calcium
Potassium
Potassium
Iron
Iron
Copper
Copper
Zinc
Zinc
Phosphorus
Phosphorus
Sodium
Sodium
Manganese
Manganese
Selenium
Selenium
4.3%
1.8%
14%
63%
16%
5.2%
7.3%
1.8%
12%
1.1%
Vitamin Comparison
Vitamin comparison score is based on the number of vitamins by which one or the other food is richer. The "coverage" charts below show how much of the daily needs can be covered by 300 grams of the food.
3
100 g
300 g
1 beet (2" dia) - 82g 1 cup - 136g
Vitamin C
Vit. C
Vitamin D
Vit. D
Vitamin A
Vit. A
Vitamin E
Vit. E
Vitamin B1
Vit. B1
Vitamin B2
Vit. B2
Vitamin B3
Vit. B3
Vitamin B5
Vit. B5
Vitamin B6
Vit. B6
Vitamin B12
Vit. B12
Vitamin K
Vit. K
Folate
Folate
16%
0%
0.67%
0.8%
7.8%
9.2%
6.3%
9.3%
15%
0%
0.5%
82%
7
100 g
300 g
1 slice - 1g 1 tbsp - 12g 1 pimiento, whole - 66g 1 cup - 192g
Vitamin C
Vit. C
Vitamin D
Vit. D
Vitamin A
Vit. A
Vitamin E
Vit. E
Vitamin B1
Vit. B1
Vitamin B2
Vit. B2
Vitamin B3
Vit. B3
Vitamin B5
Vit. B5
Vitamin B6
Vit. B6
Vitamin B12
Vit. B12
Vitamin K
Vit. K
Folate
Folate
283%
0%
44%
14%
4.3%
14%
12%
0.6%
50%
0%
21%
4.5%
All nutrients comparison - raw data values
Nutrient
DV% diff.
Vitamin C
4.9mg
84.9mg
89%
Folate
109µg
6µg
26%
Vitamin A
2µg
133µg
15%
Iron
0.8mg
1.68mg
11%
Vitamin B6
0.067mg
0.215mg
11%
Manganese
0.329mg
0.092mg
10%
Vitamin K
0.2µg
8.3µg
7%
Potassium
325mg
158mg
5%
Magnesium
23mg
6mg
4%
Fiber
2.8g
1.9g
4%
Vitamin E
0.04mg
0.69mg
4%
Copper
0.075mg
0.049mg
3%
Phosphorus
40mg
17mg
3%
Sodium
78mg
14mg
3%
Vitamin B5
0.155mg
0.01mg
3%
Vitamin B2
0.04mg
0.06mg
2%
Vitamin B3
0.334mg
0.615mg
2%
Calories
43kcal
23kcal
1%
Protein
1.61g
1.1g
1%
Carbs
9.56g
5.1g
1%
Calcium
16mg
6mg
1%
Zinc
0.35mg
0.19mg
1%
Selenium
0.7µg
0.2µg
1%
Vitamin B1
0.031mg
0.017mg
1%
Polyunsaturated fat
0.06g
0.161g
1%
Protein per 100 calories
3.7g
4.8g
N/A
Calories per 10 g protein
267kcal
209kcal
N/A
Weight per 100 calories
233g
435g
N/A
Fats
0.17g
0.3g
0%
Net carbs
6.76g
3.2g
N/A
Sugar
6.76g
2.71g
N/A
Choline
6mg
6.3mg
0%
Saturated fat
0.027g
0.045g
0%
Monounsaturated fat
0.032g
0.02g
0%
Tryptophan
0.019mg
0.014mg
0%
Threonine
0.047mg
0.04mg
0%
Isoleucine
0.048mg
0.036mg
0%
Leucine
0.068mg
0.058mg
0%
Lysine
0.058mg
0.049mg
0%
Methionine
0.018mg
0.013mg
0%
Phenylalanine
0.046mg
0.034mg
0%
Valine
0.056mg
0.046mg
0%
Histidine
0.021mg
0.022mg
0%
Macronutrient Comparison
Macronutrient breakdown side-by-side comparison
3
10%
88%
Protein:
1.61 g
Fats:
0.17 g
Carbs:
9.56 g
Water:
87.58 g
Other:
1.08 g
2
5%
93%
Protein:
1.1 g
Fats:
0.3 g
Carbs:
5.1 g
Water:
93.1 g
Other:
0.4 g
Contains
more
Protein Protein
+46.4%
Contains
more
Carbs Carbs
+87.5%
Contains
more
Other Other
+170%
Contains
more
Fats Fats
+76.5%
Fat Type Comparison
Fat type breakdown side-by-side comparison
2
23%
27%
50%
Saturated fat:
Sat. Fat
0.027 g
Monounsaturated fat:
Mono. Fat
0.032 g
Polyunsaturated fat:
Poly. Fat
0.06 g
1
20%
9%
71%
Saturated fat:
Sat. Fat
0.045 g
Monounsaturated fat:
Mono. Fat
0.02 g
Polyunsaturated fat:
Poly. Fat
0.161 g
Contains
less
Sat. Fat Saturated fat
-40%
Contains
more
Mono. Fat Monounsaturated fat
+60%
Contains
more
Poly. Fat Polyunsaturated fat
+168.3%