Beetroot nutrition: calories, carbs, GI, protein, fiber, fats
Beets, raw
*all the values are displayed for the amount of 100 grams
Medically reviewed by Ani Harutyunyan

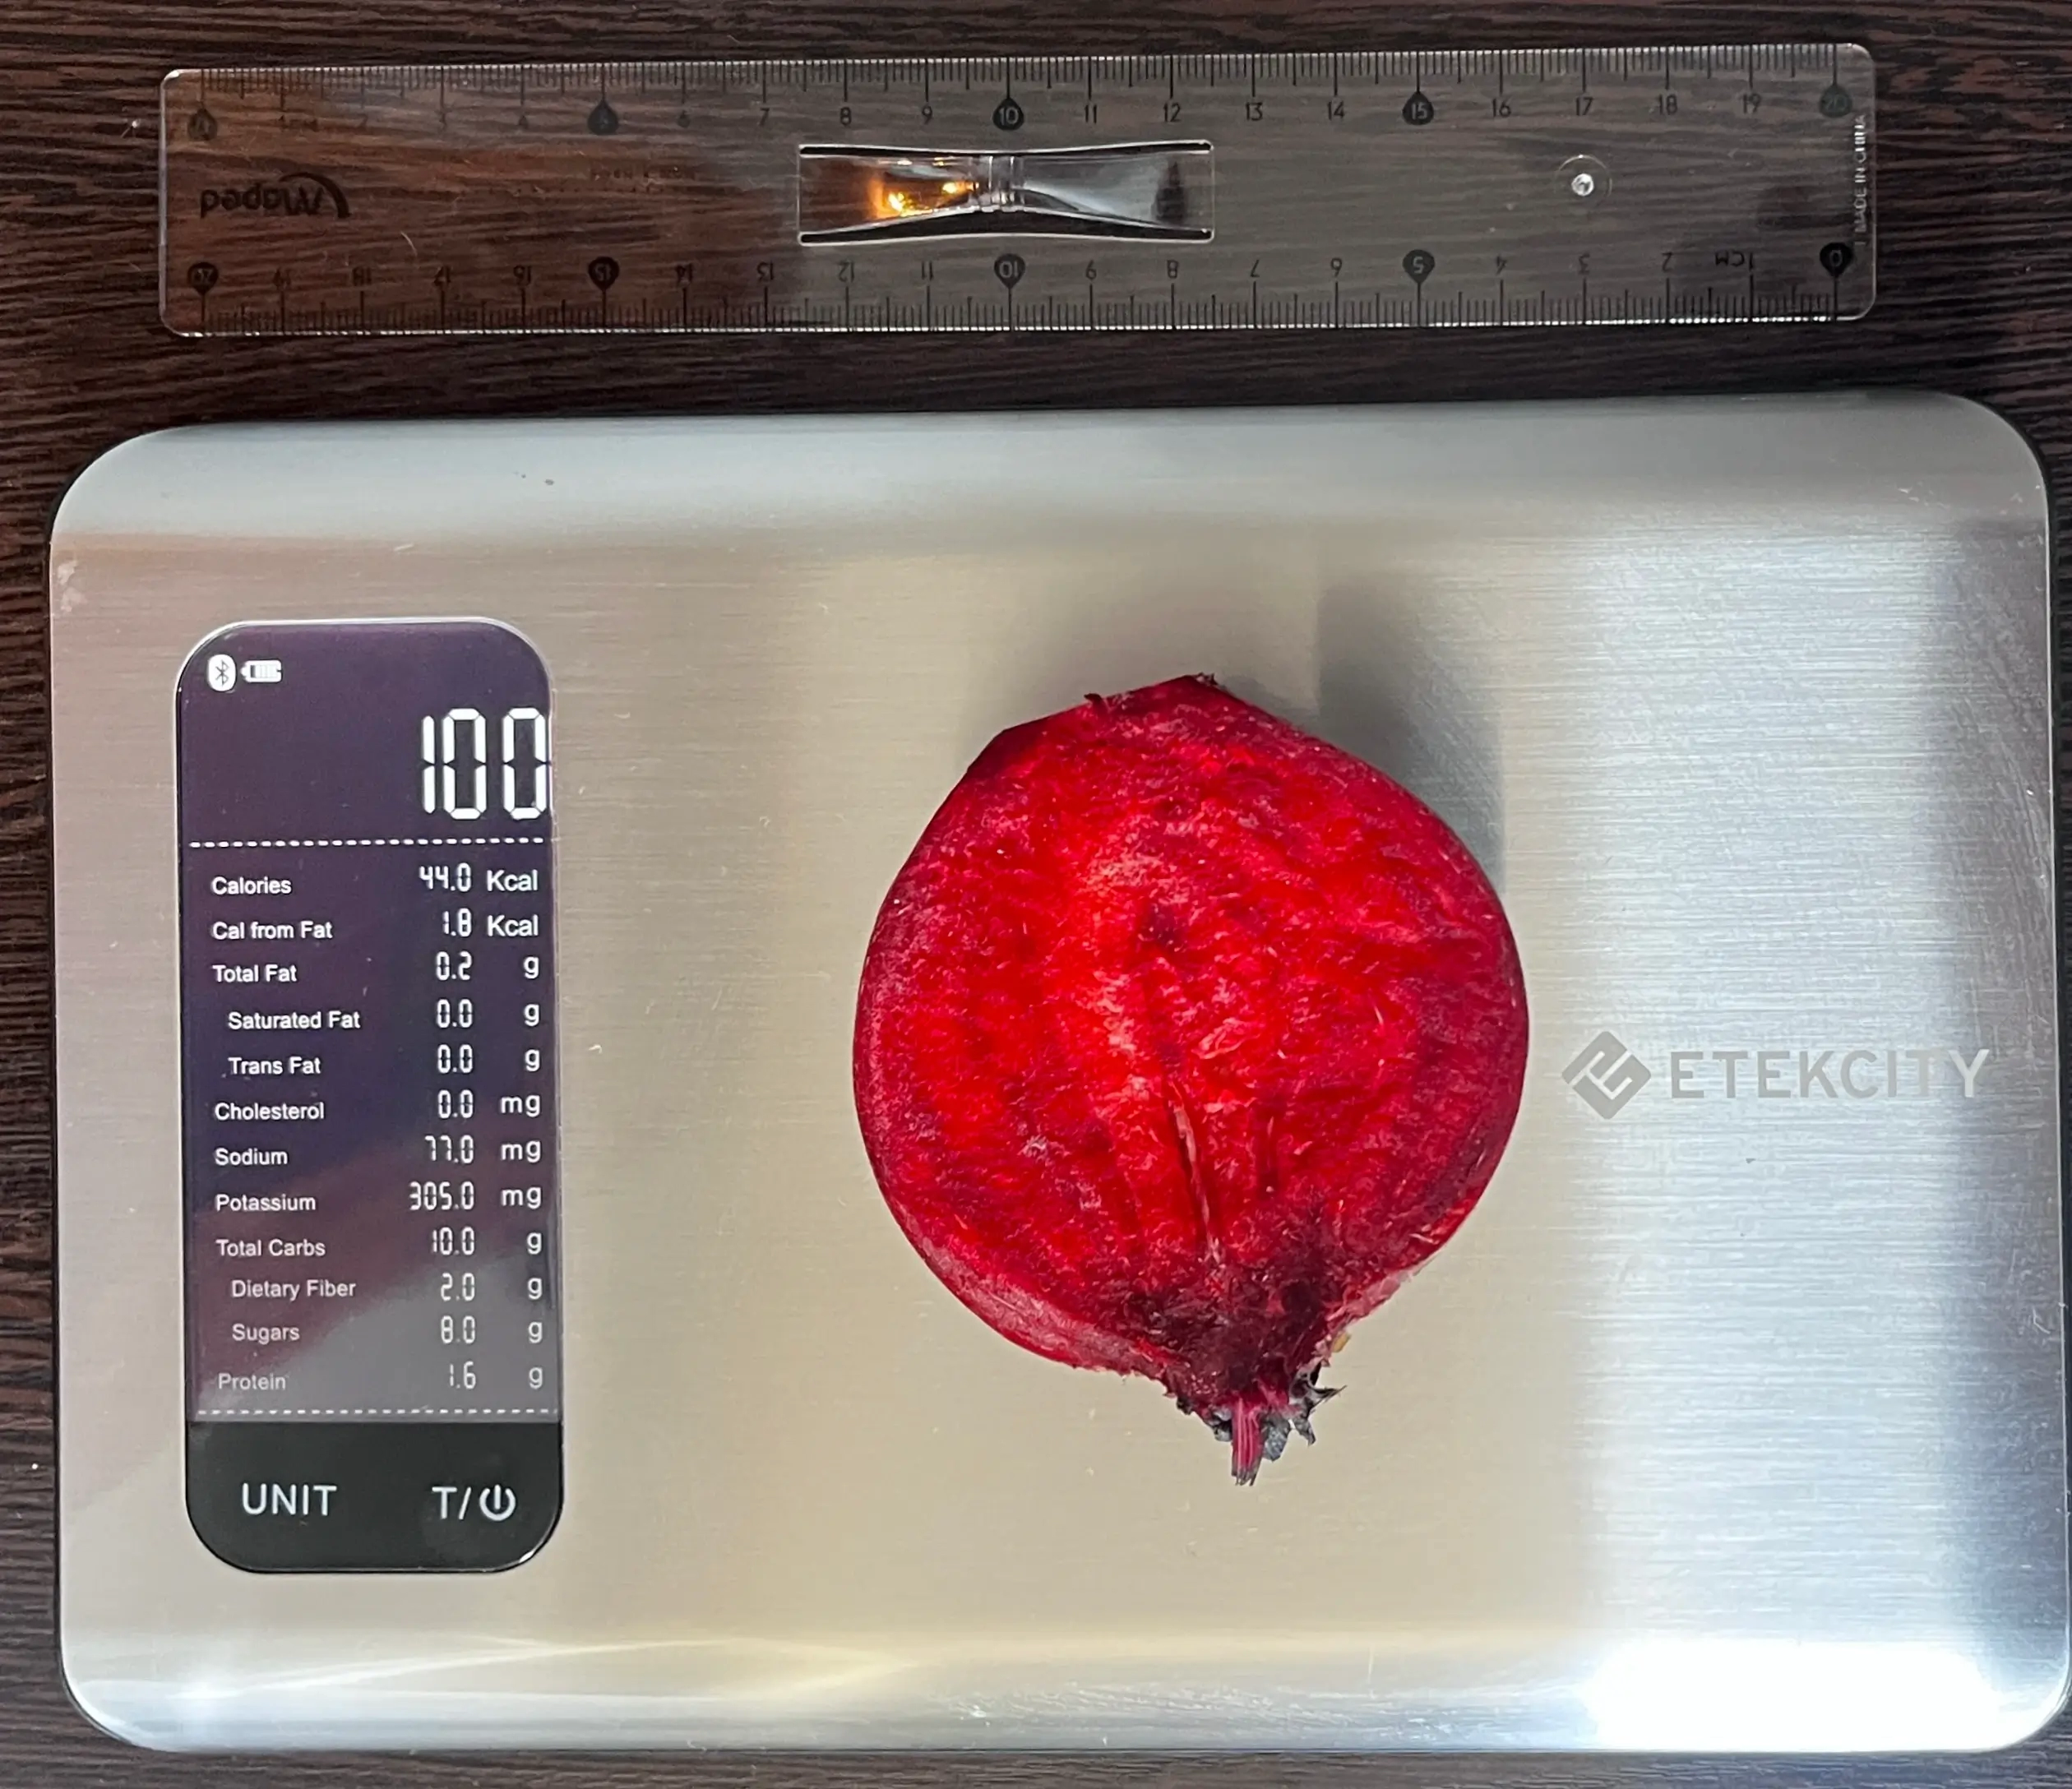
What Do 44 Calories or 100 Grams of Beetroot Look Like?
The photo below shows what 100 grams of beetroot looks like, which equals 44 calories. This helps give a clear picture of its weight and energy value.
On average, beetroots weigh between 150–200 grams, so a single medium beet contains 65–90 calories. The exact number can vary depending on the beet’s size and how ripe it is. With their naturally sweet and earthy flavor, beets are often roasted, boiled, or eaten raw in salads.

Education: Nutrition & Microbiology at YSU
Last updated: August 21, 2024
Medically reviewed by Ani Harutyunyan
Top nutrition facts for Beetroot
| Calories ⓘ Calories for selected serving | 43 kcal |
|
Glycemic index ⓘ
Source: Check out our full article on Beetroot glycemic index https://www.sciencedirect.com/science/article/pii/S0002916522004944Check out our Glycemic index chart page for the full list.
|
64 (medium) |
| Glycemic load ⓘ Glycemic Load (GL) is a metric that measures both the quality (Glycemic Index) and quantity of carbohydrates in a specific serving of food to estimate its impact on blood sugar levels. It is calculated as: (GI × Carbs in grams) / 100. | 4 (low) |
| Net carbs ⓘ Net Carbs = Total Carbohydrates – Fiber – Sugar Alcohols | 7 g |
| Default serving size ⓘ Serving sizes are mostly taken from FDA's Reference Amounts Customarily Consumed (RACCs) | 1 beet (2" dia) (82 g) |
| Acidity (Based on PRAL) ⓘ PRAL (Potential renal acid load) is calculated using a formula. On the PRAL scale the higher the positive value, the more is the acidifying effect on the body. The lower the negative value, the higher the alkalinity of the food. 0 is neutral. | -5.4 (alkaline) |
| Oxalates | 67 mg ⓘ https://www.tandfonline.com/doi/full/10.1080/10942910903326056 |
Beetroot calories (kcal)
| Calories for different serving sizes of beetroot | Calories | Weight |
|---|---|---|
| Calories in 100 grams | 43 | |
| Calories in 1 cup | 58 | 136 g |
| Calories for different varieties of beetroot | Calories | Weight |
|---|---|---|
| Beets, raw (this food) | 43 | 100 g |
| Beets, canned, no salt added, solids and liquids | 28 | 100 g |
| Beets, canned, regular pack, solids and liquids | 30 | 100 g |
| Beets, canned, drained solids | 31 | 100 g |
| Beets, cooked, boiled, drained | 44 | 100 g |
| Beets, cooked, boiled. drained, with salt | 44 | 100 g |
| Beets, pickled, canned, solids and liquids | 65 | 100 g |
| Beets, harvard, canned, solids and liquids | 73 | 100 g |
Extra Nutrition facts for Beetroot
| Protein per 100 calories ⓘ Shows how many grams of protein you get from 100 calories of this food, calculated as (protein in g ÷ calories) × 100. | 3.7 g |
| Calories per 10 g protein ⓘ Shows how many calories you need to eat from this food to get 10 g of protein, calculated as (calories ÷ protein in g) × 10. | 267 kcal |
| Weight per 100 calories ⓘ Shows how many grams of this food equal 100 kcal—higher grams mean a larger portion for the same calories. | 233 g |
Beetroot Glycemic index (GI)
Source:
Check out our full article on Beetroot glycemic index
https://www.sciencedirect.com/science/article/pii/S0002916522004944Check out our Glycemic index chart page for the full list.
Beetroot Glycemic load (GL)
Mineral coverage chart
Mineral chart - relative view
Vitamin coverage chart
Vitamin A:
6µg of 900µg
0.67%
Vitamin E:
0.12mg of 15mg
0.8%
Vitamin D:
0µg of 20µg
0%
Vitamin C:
15mg of 90mg
16%
Vitamin B1:
0.09mg of 1mg
7.8%
Vitamin B2:
0.12mg of 1mg
9.2%
Vitamin B3:
1mg of 16mg
6.3%
Vitamin B5:
0.47mg of 5mg
9.3%
Vitamin B6:
0.2mg of 1mg
15%
Folate:
327µg of 400µg
82%
Vitamin B12:
0µg of 2µg
0%
Vitamin K:
0.6µg of 120µg
0.5%
Vitamin chart - relative view
Macronutrients chart
Protein:
Daily Value: 3%
1.6 g of 50 g
1.6 g (3% of DV )
Fats:
Daily Value: 0%
0.2 g of 65 g
0.2 g (0% of DV )
Carbs:
Daily Value: 3%
9.6 g of 300 g
9.6 g (3% of DV )
Water:
Daily Value: 4%
87.6 g of 2,000 g
87.6 g (4% of DV )
Other:
1.1 g
1.1 g
Protein quality breakdown
Tryptophan:
57mg of 280mg
20%
Threonine:
141mg of 1,050mg
13%
Isoleucine:
144mg of 1,400mg
10%
Leucine:
204mg of 2,730mg
7.5%
Lysine:
174mg of 2,100mg
8.3%
Methionine:
54mg of 1,050mg
5.1%
Phenylalanine:
138mg of 1,750mg
7.9%
Valine:
168mg of 1,820mg
9.2%
Histidine:
63mg of 700mg
9%
Fat type information
Saturated fat:
0.03 g
Monounsaturated fat:
0.03 g
Polyunsaturated fat:
0.06 g
Fiber content ratio for Beetroot
Sugar:
6.8 g
Fiber:
2.8 g
Other:
0 g
All nutrients for Beetroot per 100g
| Nutrient | Value | DV% | In TOP % of foods | Comparison |
| Vitamin A | 2µg | 0% | 51% | |
| Calories | 43kcal | 2% | 90% |
1.1 times less than Orange
|
| Protein per 100 calories | 3.7g | N/A | 54% | |
| Calories per 10 g protein | 267kcal | N/A | 43% | |
| Weight per 100 calories | 233g | N/A | 11% | |
| Protein | 1.6g | 4% | 81% |
1.8 times less than Broccoli
|
| Fats | 0.17g | 0% | 90% |
195.9 times less than Cheese
|
| Vitamin C | 4.9mg | 5% | 21% |
10.8 times less than Lemon
|
| Carbs | 9.6g | 3% | 50% |
2.9 times less than Rice
|
| Net carbs | 6.8g | N/A | 53% |
8 times less than Chocolate
|
| Cholesterol | 0mg | 0% | 100% |
N/A
|
| Vitamin D* | 0 IU | 0% | 100% |
N/A
|
| Vitamin D | 0µg | 0% | 100% |
N/A
|
| Magnesium | 23mg | 5% | 42% |
6.1 times less than Almonds
|
| Calcium | 16mg | 2% | 58% |
7.8 times less than Milk
|
| Potassium | 325mg | 10% | 27% |
2.2 times more than Cucumber
|
| Iron | 0.8mg | 10% | 66% |
3.3 times less than Beef broiled
|
| Sugar | 6.8g | N/A | 24% |
1.3 times less than Coca-Cola
|
| Fiber | 2.8g | 11% | 22% |
1.2 times more than Orange
|
| Copper | 0.08mg | 8% | 53% |
1.9 times less than Shiitake
|
| Zinc | 0.35mg | 3% | 69% |
18 times less than Beef broiled
|
| Phosphorus | 40mg | 6% | 74% |
4.6 times less than Chicken meat
|
| Sodium | 78mg | 3% | 53% |
6.3 times less than White bread
|
| Vitamin E | 0.04mg | 0% | 59% |
36.5 times less than Kiwi
|
| Manganese | 0.33mg | 14% | 19% | |
| Selenium | 0.7µg | 1% | 67% | |
| Vitamin B1 | 0.03mg | 3% | 74% |
8.6 times less than Pea raw
|
| Vitamin B2 | 0.04mg | 3% | 78% |
3.3 times less than Avocado
|
| Vitamin B3 | 0.33mg | 2% | 76% |
28.7 times less than Turkey meat
|
| Vitamin B5 | 0.16mg | 3% | 59% |
7.3 times less than Sunflower seeds
|
| Vitamin B6 | 0.07mg | 5% | 64% |
1.8 times less than Oats
|
| Vitamin B12 | 0µg | 0% | 100% |
N/A
|
| Vitamin K | 0.2µg | 0% | 45% |
508 times less than Broccoli
|
| Folate | 109µg | 27% | 9% |
1.8 times more than Brussels sprouts
|
| Trans fat | 0g | N/A | 100% |
N/A
|
| Choline | 6mg | 1% | 45% | |
| Saturated fat | 0.03g | 0% | 86% |
218.3 times less than Beef broiled
|
| Monounsaturated fat | 0.03g | N/A | 79% |
306.2 times less than Avocado
|
| Polyunsaturated fat | 0.06g | N/A | 82% |
786.2 times less than Walnut
|
| Tryptophan | 0.02mg | 0% | 51% |
16.1 times less than Chicken meat
|
| Threonine | 0.05mg | 0% | 53% |
15.3 times less than Beef broiled
|
| Isoleucine | 0.05mg | 0% | 53% |
19 times less than Salmon raw
|
| Leucine | 0.07mg | 0% | 54% |
35.8 times less than Tuna Bluefin
|
| Lysine | 0.06mg | 0% | 53% |
7.8 times less than Tofu
|
| Methionine | 0.02mg | 0% | 53% |
5.3 times less than Quinoa
|
| Phenylalanine | 0.05mg | 0% | 53% |
14.5 times less than Egg
|
| Valine | 0.06mg | 0% | 53% |
36.2 times less than Soybean raw
|
| Histidine | 0.02mg | 0% | 54% |
35.7 times less than Turkey meat
|
| Caffeine | 0mg | 0% | 100% | |
| Omega-3 - EPA | 0g | N/A | 100% |
N/A
|
| Omega-3 - DHA | 0g | N/A | 100% |
N/A
|
| Omega-3 - DPA | 0g | N/A | 100% |
N/A
|
Check out similar food or compare with current
NUTRITION FACTS LABEL
Nutrition Facts
___servings per container
Serving Size ______________
Serving Size ______________
Amount Per 100g
Calories 43
% Daily Value*
0.26%
Total Fat
0.17g
0.12%
Saturated Fat 0.03g
0
Trans Fat
0g
0
Cholesterol 0mg
3.4%
Sodium 78mg
3.2%
Total Carbohydrate
9.6g
11%
Dietary Fiber
2.8g
Total Sugars 0g
Includes ? g Added Sugars
Protein
1.6g
Vitamin D
0mcg
0
Calcium
16mg
1.6%
Iron
0.8mg
10%
Potassium
325mg
9.6%
*
The % Daily Value (DV) tells you how much a nutrient in a serving of food contributes to a daily diet. 2,000 calories a day is used for general nutrition advice.
Health checks
ⓘ
Dietary cholesterol is not associated with an increased risk of coronary heart disease in healthy individuals. However, dietary cholesterol is common in foods that are high in harmful saturated fats.
Source
Low in Cholesterol
ⓘ
Trans fat consumption increases the risk of cardiovascular disease and mortality by negatively affecting blood lipid levels.
Source
No Trans Fats
ⓘ
Saturated fat intake can raise total cholesterol and LDL (low-density lipoprotein) levels, leading to an increased risk of atherosclerosis. Dietary guidelines recommend limiting saturated fats to under 10% of calories a day.
Source
Low in Saturated Fats
ⓘ
While the consumption of moderate amounts of added sugars is not detrimental to health, an excessive intake can increase the risk of obesity, and therefore, diabetes.
Source
Low in Sugars
Beetroot nutrition infographic
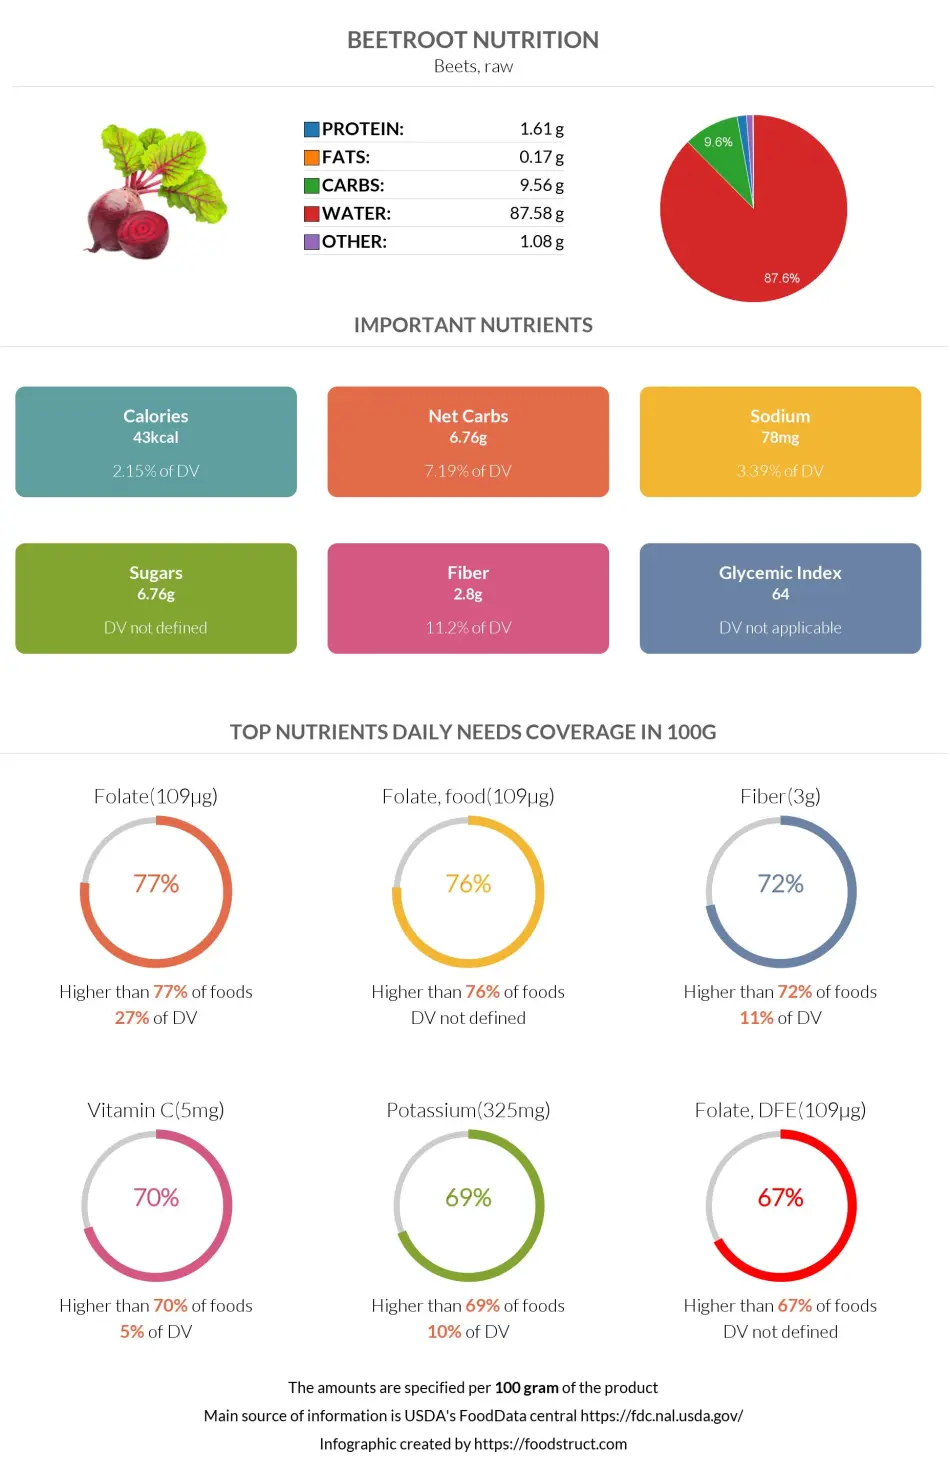
Infographic link
References
All the values for which the sources are not specified explicitly are taken from FDA’s Food Central. The exact link to the food presented on this page can be found below.