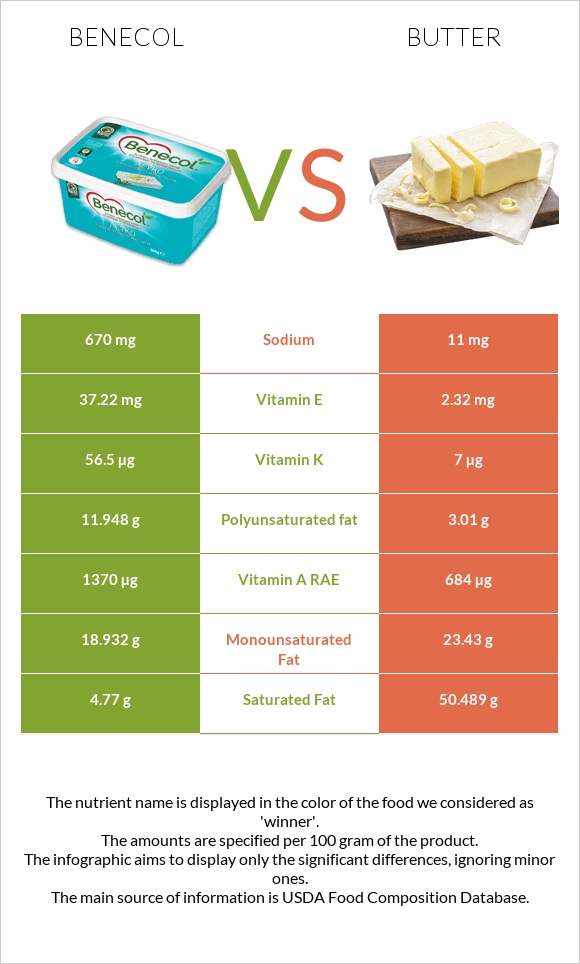
Important differences between benecol and butter Benecol has more vitamin E, vitamin A, vitamin K, and polyunsaturated fat; however, butter has more monounsaturated fat. Benecol's daily need coverage for vitamin E is 233% more. Benecol has 61 times more sodium than butter. Benecol has 670mg of sodium, while butter has 11mg. The food varieties used in the comparison are Margarine-like spread, BENECOL Light Spread and Butter, without salt .
Infographic
Mineral Comparison
Mineral comparison score is based on the number of minerals by which one or the other food is richer. The "coverage" charts below show how much of the daily needs can be covered by 300 grams of the food.
0
100 g
300 g
1 tablespoon (1 NLEA serving) - 14g
Magnesium
Magnesium
Calcium
Calcium
Potassium
Potassium
Iron
Iron
Copper
Copper
Zinc
Zinc
Phosphorus
Phosphorus
Sodium
Sodium
Manganese
Manganese
Selenium
Selenium
0.71%
1.2%
0.35%
0%
0%
0%
1.7%
87%
0%
0%
10
100 g
300 g
1 pat (1" sq, 1/3" high) - 5g 1 tbsp - 14.2g 1 stick - 113g 1 cup - 227g
Magnesium
Magnesium
Calcium
Calcium
Potassium
Potassium
Iron
Iron
Copper
Copper
Zinc
Zinc
Phosphorus
Phosphorus
Sodium
Sodium
Manganese
Manganese
Selenium
Selenium
1.4%
7.2%
2.1%
0.75%
5.3%
2.5%
10%
1.4%
0.52%
5.5%
Vitamin Comparison
Vitamin comparison score is based on the number of vitamins by which one or the other food is richer. The "coverage" charts below show how much of the daily needs can be covered by 300 grams of the food.
4
100 g
300 g
1 tablespoon (1 NLEA serving) - 14g
Vitamin C
Vit. C
Vitamin D
Vit. D
Vitamin A
Vit. A
Vitamin E
Vit. E
Vitamin B1
Vit. B1
Vitamin B2
Vit. B2
Vitamin B3
Vit. B3
Vitamin B5
Vit. B5
Vitamin B6
Vit. B6
Vitamin B12
Vit. B12
Vitamin K
Vit. K
Folate
Folate
0%
0%
457%
744%
3%
0%
0%
0%
0%
0%
141%
0%
6
100 g
300 g
1 pat (1" sq, 1/3" high) - 5g 1 tbsp - 14.2g 1 stick - 113g 1 cup - 227g
Vitamin C
Vit. C
Vitamin D
Vit. D
Vitamin A
Vit. A
Vitamin E
Vit. E
Vitamin B1
Vit. B1
Vitamin B2
Vit. B2
Vitamin B3
Vit. B3
Vitamin B5
Vit. B5
Vitamin B6
Vit. B6
Vitamin B12
Vit. B12
Vitamin K
Vit. K
Folate
Folate
0%
0%
228%
46%
1.3%
7.8%
0.79%
6.6%
0.69%
21%
18%
2.3%
All nutrients comparison - raw data values
Nutrient
DV% diff.
Vitamin E
37.22mg
2.32mg
233%
Saturated fat
4.77g
50.489g
208%
Vitamin A
1370µg
684µg
76%
Cholesterol
215mg
72%
Fats
38.71g
81.11g
65%
Polyunsaturated fat
11.948g
3.01g
60%
Vitamin K
56.5µg
7µg
41%
Sodium
670mg
11mg
29%
Calories
357kcal
717kcal
18%
Monounsaturated fat
18.932g
23.43g
11%
Vitamin B12
0.17µg
7%
Phosphorus
4mg
24mg
3%
Vitamin B2
0mg
0.034mg
3%
Choline
18.8mg
3%
Protein
0g
0.85g
2%
Carbs
5.71g
0.06g
2%
Calcium
4mg
24mg
2%
Copper
0mg
0.016mg
2%
Selenium
1µg
2%
Vitamin B5
0.11mg
2%
Potassium
4mg
24mg
1%
Zinc
0mg
0.09mg
1%
Vitamin B1
0.012mg
0.005mg
1%
Folate
3µg
1%
Weight per 100 calories
28g
14g
N/A
Unsaturated / Saturated Fat ratio
6.5
0.52
N/A
Net carbs
5.71g
0.06g
N/A
Magnesium
1mg
2mg
0%
Iron
0mg
0.02mg
0%
Sugar
0.06g
N/A
Manganese
0mg
0.004mg
0%
Vitamin B3
0mg
0.042mg
0%
Vitamin B6
0mg
0.003mg
0%
Trans fat
2.214g
N/A
Tryptophan
0.012mg
0%
Threonine
0.038mg
0%
Isoleucine
0.051mg
0%
Leucine
0.083mg
0%
Lysine
0.067mg
0%
Methionine
0.021mg
0%
Phenylalanine
0.041mg
0%
Valine
0.057mg
0%
Histidine
0.023mg
0%
Omega-3 - ALA
1.976g
0.315g
N/A
Omega-6 - Eicosadienoic acid
0.037g
N/A
Omega-6 - Linoleic acid
9.557g
2.166g
N/A
Macronutrient Comparison
Macronutrient breakdown side-by-side comparison
3
39%
6%
54%
2%
Protein:
0 g
Fats:
38.71 g
Carbs:
5.71 g
Water:
53.73 g
Other:
1.85 g
2
81%
18%
Protein:
0.85 g
Fats:
81.11 g
Carbs:
0.06 g
Water:
17.94 g
Other:
0.04 g
Contains
more
Carbs Carbs
+9416.7%
Contains
more
Water Water
+199.5%
Contains
more
Other Other
+4525%
Contains
more
Protein Protein
+∞%
Contains
more
Fats Fats
+109.5%
Fat Type Comparison
Fat type breakdown side-by-side comparison
2
13%
53%
34%
Saturated fat:
Sat. Fat
4.77 g
Monounsaturated fat:
Mono. Fat
18.932 g
Polyunsaturated fat:
Poly. Fat
11.948 g
1
66%
30%
4%
Saturated fat:
Sat. Fat
50.489 g
Monounsaturated fat:
Mono. Fat
23.43 g
Polyunsaturated fat:
Poly. Fat
3.01 g
Contains
less
Sat. Fat Saturated fat
-90.6%
Contains
more
Poly. Fat Polyunsaturated fat
+296.9%
Contains
more
Mono. Fat Monounsaturated fat
+23.8%