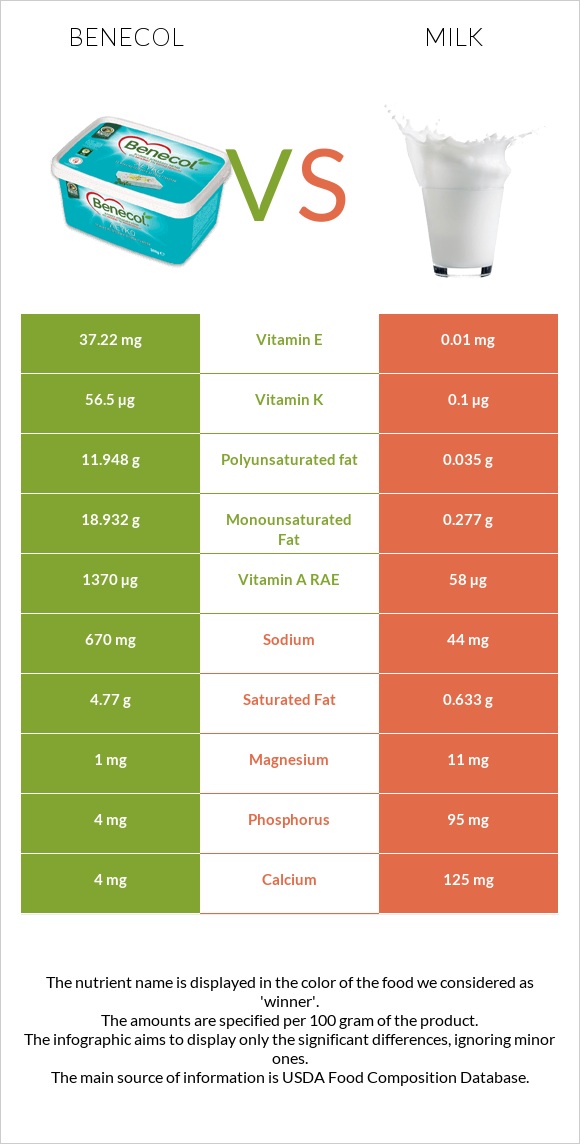
How are benecol and milk different? Benecol is higher in vitamin E, vitamin A, and vitamin K; however, milk is richer in vitamin B2, phosphorus, and calcium. Daily need coverage for vitamin E for benecol is 248% higher. Benecol contains 565 times more vitamin K than milk. While benecol contains 56.5µg of vitamin K, milk contains only 0.1µg. Milk has less sodium. Margarine-like spread, BENECOL Light Spread and Milk, lowfat, fluid, 1% milkfat, with added vitamin A and vitamin D are the varieties used in this article.
Infographic
Mineral Comparison
Mineral comparison score is based on the number of minerals by which one or the other food is richer. The "coverage" charts below show how much of the daily needs can be covered by 300 grams of the food.
0
100 g
300 g
1 tablespoon (1 NLEA serving) - 14g
Magnesium
Magnesium
Calcium
Calcium
Potassium
Potassium
Iron
Iron
Copper
Copper
Zinc
Zinc
Phosphorus
Phosphorus
Sodium
Sodium
Manganese
Manganese
Selenium
Selenium
0.71%
1.2%
0.35%
0%
0%
0%
1.7%
87%
0%
0%
10
100 g
300 g
1 fl oz - 30.5g 1 cup - 244g 1 quart - 976g
Magnesium
Magnesium
Calcium
Calcium
Potassium
Potassium
Iron
Iron
Copper
Copper
Zinc
Zinc
Phosphorus
Phosphorus
Sodium
Sodium
Manganese
Manganese
Selenium
Selenium
7.9%
38%
13%
1.1%
3.3%
11%
41%
5.7%
0.39%
18%
Vitamin Comparison
Vitamin comparison score is based on the number of vitamins by which one or the other food is richer. The "coverage" charts below show how much of the daily needs can be covered by 300 grams of the food.
3
100 g
300 g
1 tablespoon (1 NLEA serving) - 14g
Vitamin C
Vit. C
Vitamin D
Vit. D
Vitamin A
Vit. A
Vitamin E
Vit. E
Vitamin B1
Vit. B1
Vitamin B2
Vit. B2
Vitamin B3
Vit. B3
Vitamin B5
Vit. B5
Vitamin B6
Vit. B6
Vitamin B12
Vit. B12
Vitamin K
Vit. K
Folate
Folate
0%
0%
457%
744%
3%
0%
0%
0%
0%
0%
141%
0%
8
100 g
300 g
1 fl oz - 30.5g 1 cup - 244g 1 quart - 976g
Vitamin C
Vit. C
Vitamin D
Vit. D
Vitamin A
Vit. A
Vitamin E
Vit. E
Vitamin B1
Vit. B1
Vitamin B2
Vit. B2
Vitamin B3
Vit. B3
Vitamin B5
Vit. B5
Vitamin B6
Vit. B6
Vitamin B12
Vit. B12
Vitamin K
Vit. K
Folate
Folate
0%
18%
19%
0.2%
5%
43%
1.7%
22%
8.5%
59%
0.25%
3.8%
All nutrients comparison - raw data values
Nutrient
DV% diff.
Vitamin E
37.22mg
0.01mg
248%
Vitamin A
1370µg
58µg
146%
Polyunsaturated fat
11.948g
0.035g
79%
Fats
38.71g
0.97g
58%
Vitamin K
56.5µg
0.1µg
47%
Monounsaturated fat
18.932g
0.277g
47%
Sodium
670mg
44mg
27%
Vitamin B12
0.47µg
20%
Saturated fat
4.77g
0.633g
19%
Calories
357kcal
42kcal
16%
Vitamin B2
0mg
0.185mg
14%
Phosphorus
4mg
95mg
13%
Calcium
4mg
125mg
12%
Protein
0g
3.37g
7%
Vitamin B5
0.361mg
7%
Vitamin D*
48 IU
6%
Vitamin D
1.2µg
6%
Selenium
3.3µg
6%
Potassium
4mg
150mg
4%
Zinc
0mg
0.42mg
4%
Vitamin B6
0mg
0.037mg
3%
Choline
17.7mg
3%
Cholesterol
5mg
2%
Magnesium
1mg
11mg
2%
Copper
0mg
0.01mg
1%
Vitamin B1
0.012mg
0.02mg
1%
Vitamin B3
0mg
0.093mg
1%
Folate
5µg
1%
Protein per 100 calories
0g
8g
N/A
Calories per 10 g protein
125kcal
N/A
Weight per 100 calories
28g
238g
N/A
Unsaturated / Saturated Fat ratio
6.5
0.49
N/A
Net carbs
5.71g
4.99g
N/A
Carbs
5.71g
4.99g
0%
Iron
0mg
0.03mg
0%
Sugar
5.2g
N/A
Manganese
0mg
0.003mg
0%
Trans fat
2.214g
N/A
Tryptophan
0.043mg
0%
Threonine
0.143mg
0%
Isoleucine
0.174mg
0%
Leucine
0.319mg
0%
Lysine
0.282mg
0%
Methionine
0.088mg
0%
Phenylalanine
0.174mg
0%
Valine
0.22mg
0%
Histidine
0.101mg
0%
Omega-3 - ALA
1.976g
0.004g
N/A
Omega-6 - Eicosadienoic acid
0.037g
N/A
Omega-6 - Linoleic acid
9.557g
0.027g
N/A
Macronutrient Comparison
Macronutrient breakdown side-by-side comparison
3
39%
6%
54%
2%
Protein:
0 g
Fats:
38.71 g
Carbs:
5.71 g
Water:
53.73 g
Other:
1.85 g
2
3%
5%
90%
Protein:
3.37 g
Fats:
0.97 g
Carbs:
4.99 g
Water:
89.92 g
Other:
0.75 g
Contains
more
Fats Fats
+3890.7%
Contains
more
Carbs Carbs
+14.4%
Contains
more
Other Other
+146.7%
Contains
more
Protein Protein
+∞%
Contains
more
Water Water
+67.4%
Fat Type Comparison
Fat type breakdown side-by-side comparison
2
13%
53%
34%
Saturated fat:
Sat. Fat
4.77 g
Monounsaturated fat:
Mono. Fat
18.932 g
Polyunsaturated fat:
Poly. Fat
11.948 g
1
67%
29%
4%
Saturated fat:
Sat. Fat
0.633 g
Monounsaturated fat:
Mono. Fat
0.277 g
Polyunsaturated fat:
Poly. Fat
0.035 g
Contains
more
Mono. Fat Monounsaturated fat
+6734.7%
Contains
more
Poly. Fat Polyunsaturated fat
+34037.1%
Contains
less
Sat. Fat Saturated fat
-86.7%