Biscuit vs. Cornbread — In-Depth Nutrition Comparison
Compare
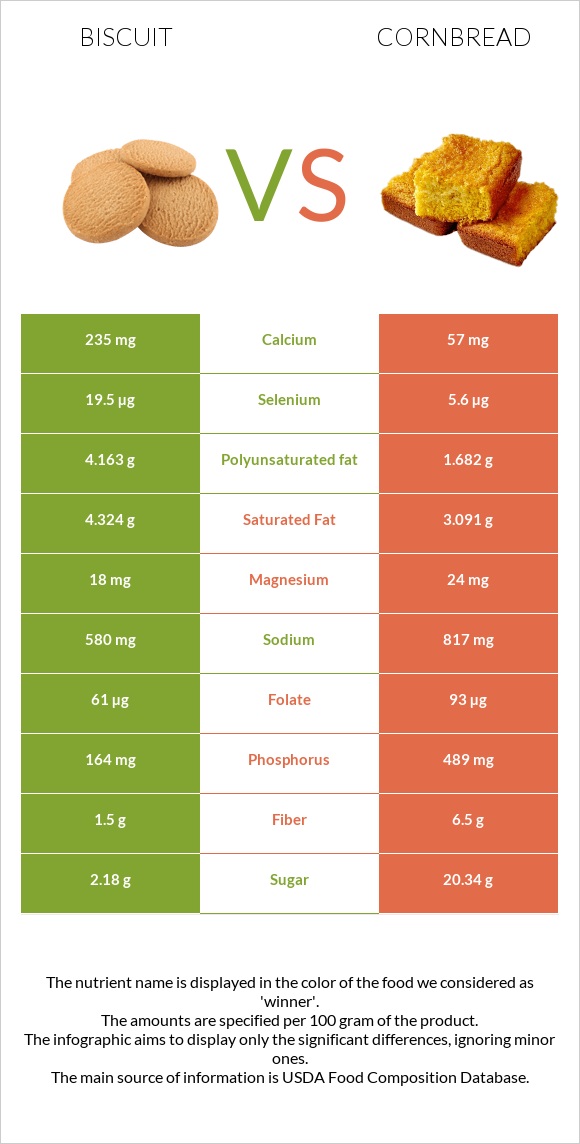
How are biscuits and cornbread different?
- Biscuits are higher in selenium, vitamin B1, iron, vitamin B2, calcium, manganese, and vitamin B3; however, cornbread is richer in phosphorus and vitamin B12.
- Daily need coverage for phosphorus for cornbread is 32% higher.
- Biscuits contain 2 times more selenium than cornbread. While biscuits contain 19.5µg of selenium, cornbread contains only 8.7µg.
- Biscuits have less cholesterol.
- Biscuits have a lower glycemic index (44) than cornbread (76).
Biscuits, plain or buttermilk, prepared from recipe and Bread, cornbread, dry mix, prepared with 2% milk, 80% margarine, and eggs are the varieties used in this article.
Infographic
Infographic link
Mineral Comparison
Mineral comparison score is based on the number of minerals by which one or the other food is richer. The "coverage" charts below show how much of the daily needs can be covered by 300 grams of the food.
| Contains more CalciumCalcium | +74.1% |
| Contains more IronIron | +56.8% |
| Contains more CopperCopper | +12.3% |
| Contains more ManganeseManganese | +70.3% |
| Contains more SeleniumSelenium | +124.1% |
| Contains more ZincZinc | +24.1% |
| Contains more PhosphorusPhosphorus | +138.4% |
Vitamin Comparison
Vitamin comparison score is based on the number of vitamins by which one or the other food is richer. The "coverage" charts below show how much of the daily needs can be covered by 300 grams of the food.
| Contains more Vitamin CVitamin C | +100% |
| Contains more Vitamin B1Vitamin B1 | +87.4% |
| Contains more Vitamin B2Vitamin B2 | +77.1% |
| Contains more Vitamin B3Vitamin B3 | +47.2% |
| Contains more Vitamin B5Vitamin B5 | +103.2% |
| Contains more Vitamin B6Vitamin B6 | +142.9% |
| Contains more Vitamin B12Vitamin B12 | +187.5% |
All nutrients comparison - raw data values
| Nutrient |  |
 |
DV% diff. |
| Phosphorus | 164mg | 391mg | 32% |
| Selenium | 19.5µg | 8.7µg | 20% |
| Cholesterol | 3mg | 57mg | 18% |
| Starch | 35.66g | 15% | |
| Polyunsaturated fat | 4.163g | 1.963g | 15% |
| Vitamin B1 | 0.356mg | 0.19mg | 14% |
| Iron | 2.9mg | 1.85mg | 13% |
| Choline | 58.7mg | 11% | |
| Fats | 16.3g | 9.58g | 10% |
| Calcium | 235mg | 135mg | 10% |
| Vitamin B2 | 0.31mg | 0.175mg | 10% |
| Monounsaturated fat | 6.93g | 3.494g | 9% |
| Manganese | 0.378mg | 0.222mg | 7% |
| Vitamin B3 | 2.949mg | 2.004mg | 6% |
| Vitamin B5 | 0.285mg | 0.579mg | 6% |
| Vitamin B12 | 0.08µg | 0.23µg | 6% |
| Vitamin A | 35µg | 4% | |
| Vitamin B6 | 0.035mg | 0.085mg | 4% |
| Carbs | 44.6g | 54.46g | 3% |
| Fiber | 1.5g | 2.3g | 3% |
| Vitamin E | 0.51mg | 3% | |
| Vitamin K | 3.7µg | 3% | |
| Saturated fat | 4.324g | 3.732g | 3% |
| Folate | 61µg | 55µg | 2% |
| Calories | 353kcal | 330kcal | 1% |
| Protein | 7g | 6.59g | 1% |
| Copper | 0.082mg | 0.073mg | 1% |
| Zinc | 0.54mg | 0.67mg | 1% |
| Sodium | 580mg | 599mg | 1% |
| Protein per 100 calories | 2g | 2g | N/A |
| Calories per 10 g protein | 504kcal | 501kcal | N/A |
| Weight per 100 calories | 28g | 30g | N/A |
| Unsaturated / Saturated Fat ratio | 2.6 | 1.5 | N/A |
| Vitamin C | 0.2mg | 0.1mg | 0% |
| Net carbs | 43.1g | 52.16g | N/A |
| Magnesium | 18mg | 17mg | 0% |
| Potassium | 121mg | 133mg | 0% |
| Sugar | 2.18g | 16.05g | N/A |
| Trans fat | 0.224g | N/A | |
| Tryptophan | 0.087mg | 0.059mg | 0% |
| Threonine | 0.211mg | 0.226mg | 0% |
| Isoleucine | 0.273mg | 0.265mg | 0% |
| Leucine | 0.514mg | 0.658mg | 0% |
| Lysine | 0.226mg | 0.324mg | 0% |
| Methionine | 0.132mg | 0.157mg | 0% |
| Phenylalanine | 0.347mg | 0.343mg | 0% |
| Valine | 0.313mg | 0.334mg | 0% |
| Histidine | 0.161mg | 0.167mg | 0% |
| Fructose | 0.2g | 0% | |
| Omega-3 - DHA | 0g | 0.007g | N/A |
| Omega-3 - ALA | 0.076g | N/A | |
| Omega-3 - DPA | 0g | 0.003g | N/A |
| Omega-3 - Eicosatrienoic acid | 0.004g | N/A | |
| Omega-6 - Gamma-linoleic acid | 0.004g | N/A | |
| Omega-6 - Dihomo-gamma-linoleic acid | 0.009g | N/A | |
| Omega-6 - Eicosadienoic acid | 0.043g | N/A | |
| Omega-6 - Linoleic acid | 1.726g | N/A |
Macronutrient Comparison
Macronutrient breakdown side-by-side comparison
| Contains more FatsFats | +70.1% |
| Contains more OtherOther | +41.6% |
| Contains more CarbsCarbs | +22.1% |
~equal in
Protein
~6.59g
~equal in
Water
~27.11g
Fat Type Comparison
Fat type breakdown side-by-side comparison
| Contains more Mono. FatMonounsaturated fat | +98.3% |
| Contains more Poly. FatPolyunsaturated fat | +112.1% |
| Contains less Sat. FatSaturated fat | -13.7% |


