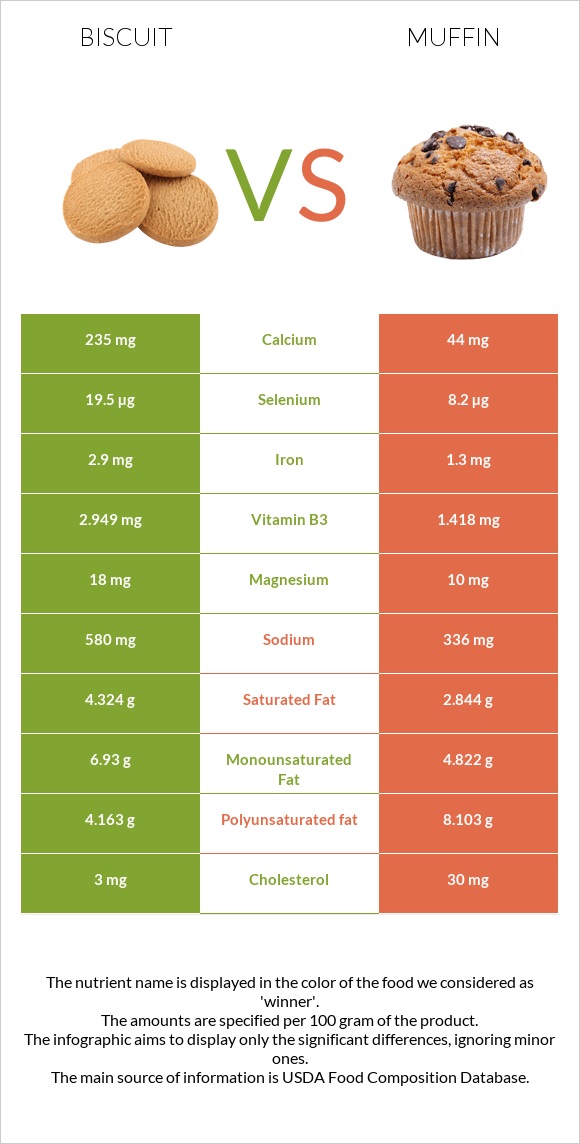
Significant differences between biscuits and muffin The amount of selenium, iron, calcium, vitamin B1, vitamin B2, and vitamin B3 in biscuits is higher than in muffin. Biscuits cover your daily selenium needs 21% more than muffin. Muffin has 5 times less calcium than biscuits. Biscuits have 235mg of calcium, while muffin has 44mg. Muffin contains less sodium. Muffin has a higher glycemic index. The glycemic index of muffin is 59, while the glycemic index of biscuits is 44. Specific food types used in this comparison are Biscuits, plain or buttermilk, prepared from recipe and Muffins, blueberry, commercially prepared (Includes mini-muffins) .
Infographic
Mineral Comparison
Mineral comparison score is based on the number of minerals by which one or the other food is richer. The "coverage" charts below show how much of the daily needs can be covered by 300 grams of the food.
7
100 g
300 g
1 small (1-1/2" dia) - 14g 1 oz - 28.35g 1 biscuit (2-1/2" dia) - 60g 1 biscuit (4" dia) - 101g
Magnesium
Magnesium
Calcium
Calcium
Potassium
Potassium
Iron
Iron
Copper
Copper
Zinc
Zinc
Phosphorus
Phosphorus
Sodium
Sodium
Manganese
Manganese
Selenium
Selenium
13%
71%
11%
109%
27%
15%
70%
76%
49%
106%
2
100 g
300 g
1 mini (1-1/4" dia) - 17g 1 oz - 28.35g 1 muffin - 31g 1 small (2-3/4" dia x 2") - 66g 1 medium - 113g 1 large (3-1/4" dia x 2-3/4") - 139g 1 extra large - 168g
Magnesium
Magnesium
Calcium
Calcium
Potassium
Potassium
Iron
Iron
Copper
Copper
Zinc
Zinc
Phosphorus
Phosphorus
Sodium
Sodium
Manganese
Manganese
Selenium
Selenium
7.1%
13%
11%
49%
20%
10%
63%
44%
59%
45%
Vitamin Comparison
Vitamin comparison score is based on the number of vitamins by which one or the other food is richer. The "coverage" charts below show how much of the daily needs can be covered by 300 grams of the food.
4
100 g
300 g
1 small (1-1/2" dia) - 14g 1 oz - 28.35g 1 biscuit (2-1/2" dia) - 60g 1 biscuit (4" dia) - 101g
Vitamin C
Vit. C
Vitamin D
Vit. D
Vitamin A
Vit. A
Vitamin E
Vit. E
Vitamin B1
Vit. B1
Vitamin B2
Vit. B2
Vitamin B3
Vit. B3
Vitamin B5
Vit. B5
Vitamin B6
Vit. B6
Vitamin B12
Vit. B12
Vitamin K
Vit. K
Folate
Folate
0.67%
0%
0%
0%
89%
72%
55%
17%
8.1%
10%
0%
46%
8
100 g
300 g
1 mini (1-1/4" dia) - 17g 1 oz - 28.35g 1 muffin - 31g 1 small (2-3/4" dia x 2") - 66g 1 medium - 113g 1 large (3-1/4" dia x 2-3/4") - 139g 1 extra large - 168g
Vitamin C
Vit. C
Vitamin D
Vit. D
Vitamin A
Vit. A
Vitamin E
Vit. E
Vitamin B1
Vit. B1
Vitamin B2
Vit. B2
Vitamin B3
Vit. B3
Vitamin B5
Vit. B5
Vitamin B6
Vit. B6
Vitamin B12
Vit. B12
Vitamin K
Vit. K
Folate
Folate
3%
1.5%
7%
33%
42%
38%
27%
28%
9.2%
20%
98%
36%
All nutrients comparison - raw data values
Nutrient
DV% diff.
Vitamin K
39.2µg
33%
Polyunsaturated fat
4.163g
8.103g
26%
Selenium
19.5µg
8.2µg
21%
Iron
2.9mg
1.3mg
20%
Calcium
235mg
44mg
19%
Choline
92.5mg
17%
Vitamin B1
0.356mg
0.168mg
16%
Sodium
580mg
336mg
11%
Vitamin E
1.63mg
11%
Vitamin B2
0.31mg
0.163mg
11%
Vitamin B3
2.949mg
1.418mg
10%
Cholesterol
3mg
30mg
9%
Starch
16.31g
7%
Saturated fat
4.324g
2.844g
7%
Protein
7g
4.49g
5%
Monounsaturated fat
6.93g
4.822g
5%
Vitamin B5
0.285mg
0.47mg
4%
Carbs
44.6g
53g
3%
Phosphorus
164mg
146mg
3%
Manganese
0.378mg
0.449mg
3%
Vitamin B12
0.08µg
0.16µg
3%
Folate
61µg
48µg
3%
Magnesium
18mg
10mg
2%
Fiber
1.5g
1.1g
2%
Copper
0.082mg
0.06mg
2%
Zinc
0.54mg
0.37mg
2%
Vitamin A
21µg
2%
Fructose
1.21g
2%
Calories
353kcal
375kcal
1%
Vitamin C
0.2mg
0.9mg
1%
Vitamin D*
4 IU
1%
Vitamin D
0.1µg
1%
Protein per 100 calories
2g
1.2g
N/A
Calories per 10 g protein
504kcal
835kcal
N/A
Weight per 100 calories
28g
27g
N/A
Fats
16.3g
16.07g
0%
Unsaturated / Saturated Fat ratio
2.6
4.5
N/A
Net carbs
43.1g
51.9g
N/A
Potassium
121mg
121mg
0%
Sugar
2.18g
31.47g
N/A
Vitamin B6
0.035mg
0.04mg
0%
Trans fat
0.2g
N/A
Tryptophan
0.087mg
0.066mg
0%
Threonine
0.211mg
0.181mg
0%
Isoleucine
0.273mg
0.224mg
0%
Leucine
0.514mg
0.421mg
0%
Lysine
0.226mg
0.199mg
0%
Methionine
0.132mg
0.115mg
0%
Phenylalanine
0.347mg
0.277mg
0%
Valine
0.313mg
0.257mg
0%
Histidine
0.161mg
0.128mg
0%
Omega-3 - DHA
0g
0.008g
N/A
Omega-3 - ALA
1.022g
N/A
Omega-3 - DPA
0g
0.001g
N/A
Omega-6 - Gamma-linoleic acid
0.048g
N/A
Omega-6 - Dihomo-gamma-linoleic acid
0.002g
N/A
Omega-6 - Eicosadienoic acid
0.007g
N/A
Omega-6 - Linoleic acid
6.911g
N/A
Macronutrient Comparison
Macronutrient breakdown side-by-side comparison
4
7%
16%
45%
29%
3%
Protein:
7 g
Fats:
16.3 g
Carbs:
44.6 g
Water:
28.9 g
Other:
3.2 g
1
4%
16%
53%
25%
Protein:
4.49 g
Fats:
16.07 g
Carbs:
53 g
Water:
24.96 g
Other:
1.48 g
Contains
more
Protein Protein
+55.9%
Contains
more
Water Water
+15.8%
Contains
more
Other Other
+116.2%
Contains
more
Carbs Carbs
+18.8%
Fat Type Comparison
Fat type breakdown side-by-side comparison
1
28%
45%
27%
Saturated fat:
Sat. Fat
4.324 g
Monounsaturated fat:
Mono. Fat
6.93 g
Polyunsaturated fat:
Poly. Fat
4.163 g
2
18%
31%
51%
Saturated fat:
Sat. Fat
2.844 g
Monounsaturated fat:
Mono. Fat
4.822 g
Polyunsaturated fat:
Poly. Fat
8.103 g
Contains
more
Mono. Fat Monounsaturated fat
+43.7%
Contains
less
Sat. Fat Saturated fat
-34.2%
Contains
more
Poly. Fat Polyunsaturated fat
+94.6%