Blackberry vs. Elderberry — Health Impact and Nutrition Comparison


Summary
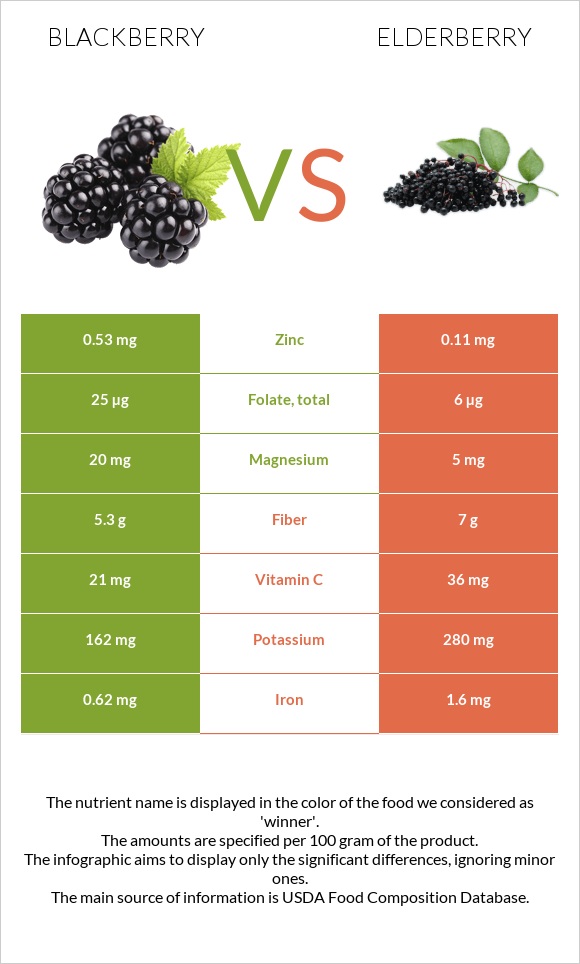
Elderberries are higher in calories and 2 times richer in carbohydrates, including both net carbs and dietary fiber. It also contains 8 times more vitamin B6 and 3 times more vitamins B1 and A and iron.
Blackberry is 4 times richer in folate and magnesium, 5 times higher in zinc, and 3 times higher in copper.
Introduction
This article compares the nutritional profile and health impact of raw blackberry and elderberry (1, 2).
Sambucus nigra, known as European elderberry, is common in many parts of the world. It has black or blue-black berries and creamy flowers. Elderberry flowers and berries are used in folk medicine for pain relief and as a laxative and diuretic (3). Moreover, flowers are used for making sweet syrup. It is common to prepare juice, jams, and wine from elderberries.
Blackberry is a sweet, slightly tart berry from the family Rosaceae. It is commonly consumed raw as an additive to baked food products or ice cream. Blackberry is often used for making jams and juice.
The taste of elderberries is also often described as sweet and tart but with a slightly floral undertone.
Nutrition
The nutritional infographics below are presented for 100g servings of raw elderberries and blackberries.
However, one average serving size of these berries per person is considered one cup, weighing about 145g.
Macronutrients
Elderberry is slightly denser in nutrients, consisting of 80% water and 20% nutrients, while blackberry is made up of 88% water and 12% nutrients.
The main macronutrient found in both these berries is carbohydrates - 18% for elderberry and 10% for blackberry.
The amounts of nutrients these foods provide are shown below.
Macronutrient Comparison
Contains
more
ProteinProtein
+110.6%
Contains
more
CarbsCarbs
+91.5%
Contains
more
OtherOther
+77.8%
Calories
Blackberry and elderberry are plant products and low-calorie foods. However, elderberry is higher in calories by 30 calories per 100g.
Carbs
Elderberry is 2 times higher in carbs, providing 18.4g per 100g serving, while the same serving of blackberry has 9.6g of carbohydrates.
Both berries are excellent sources of dietary fiber; however, elderberry provides 1.7g more dietary fiber per 100g than blackberry,
Elderberry is rich in soluble fiber. It falls in the top 15% of foods as a source of dietary fiber.
Blackberry is lower in net carbs: 100g has 4.3g of net carbs, while the same quantity of elderberry contains 11.4g.
Protein
These two berries do not contain much protein. Still, blackberry is 2 times higher in proteins than elderberry.
Fats
Both berries have negligible amounts of fats - 0.5 of fat per 100g. Blackberry and elderberry do not contain any amount of cholesterol.
Vitamins
Blackberry and elderberry are rich in different vitamins.
Elderberries are an excellent source of vitamin C: they are higher in vitamin C (36mg per 100g) than blackberries (21mg per 100g).
Blackberry is 4 times richer in folate and higher in vitamins B3 and B5, while elderberry provides more vitamins B1, B2, B6, and A.
Elderberry contains 8 times more vitamin B6 and 3 times more vitamins B1 and A.
Vitamin Comparison
Contains
more
Vitamin EVitamin E
+∞%
Contains
more
Vitamin B3Vitamin B3
+29.2%
Contains
more
Vitamin B5Vitamin B5
+97.1%
Contains
more
Vitamin KVitamin K
+∞%
Contains
more
FolateFolate
+316.7%
Contains
more
Vitamin CVitamin C
+71.4%
Contains
more
Vitamin AVitamin A
+172.7%
Contains
more
Vitamin B1Vitamin B1
+250%
Contains
more
Vitamin B2Vitamin B2
+130.8%
Contains
more
Vitamin B6Vitamin B6
+666.7%
Minerals
Blackberry is 5 times higher in zinc, 4 times higher in magnesium, and 3 times higher in copper. Elderberry is also lower in sodium.
Elderberry is 3 times richer in iron and overall richer in calcium, phosphorus, potassium, and selenium.
You can compare the mineral composition of these two berries in the chart below.
Mineral Comparison
Contains
more
MagnesiumMagnesium
+300%
Contains
more
CopperCopper
+170.5%
Contains
more
ZincZinc
+381.8%
Contains
less
SodiumSodium
-83.3%
Contains
more
ManganeseManganese
+∞%
Contains
more
CalciumCalcium
+31%
Contains
more
PotassiumPotassium
+72.8%
Contains
more
IronIron
+158.1%
Contains
more
PhosphorusPhosphorus
+77.3%
Contains
more
SeleniumSelenium
+50%
Health impact
Cardiovascular health
Both elderberries and blackberries promote cardiovascular health by providing different phytochemicals.
Elderberries have shown beneficial effects by lowering blood fat and cholesterol levels (4). They are also antioxidants, reducing uric acid levels in the bloodstream (5). A high uric acid content may increase blood pressure and harm the cardiovascular system (6).
Thus, elderberries can help prevent the incidence of cardiovascular diseases and type 2 diabetes mellitus (5).
Blackberries are packed with vitamin K, essential for blood clothing (7). Moreover, blackberries have strong antioxidant and anti-inflammatory qualities (8, 9).
Cancer
Elderberries have shown anticancer properties in some test-tube studies (10). However, human studies are needed to confirm these findings.
Blackberries may reduce the formation of carcinogens in the organism by their vitamin C content (11).
Downsides
Besides the health benefits described above, blackberries and elderberries may also have harmful effects on your health.
The unripe seeds and raw berries of the elderberry tree contain some amounts of cyanide - a dangerous toxin that harms the electron transport chain and energy synthesis in the organism (12). Symptoms of consuming raw elderberries can be diarrhea, nausea, and vomiting.
In some cases, such as post-bowel surgery, it is recommended to follow a low-fiber diet. Being high-fiber foods, blackberries and elderberries should be excluded from the diet (13).
References
- https://fdc.nal.usda.gov/fdc-app.html#/food-details/173946/nutrients
- https://fdc.nal.usda.gov/fdc-app.html#/food-details/171727/nutrients
- https://pubmed.ncbi.nlm.nih.gov/24409980/
- https://onlinelibrary.wiley.com/doi/abs/10.1002/ptr.2729
- https://www.sciencedirect.com/science/article/pii/S1756464614002400
- https://www.ncbi.nlm.nih.gov/pmc/articles/PMC4865070/
- https://pubmed.ncbi.nlm.nih.gov/8527228/
- https://www.mdpi.com/2076-3417/12/8/4004
- https://pubmed.ncbi.nlm.nih.gov/35487829/
- https://pubmed.ncbi.nlm.nih.gov/17201636/
- https://ods.od.nih.gov/factsheets/VitaminC-HealthProfessional/
- Assessment report on Sambucus nigra L., fructus
- What to eat after bowel surgery

Infographic
All nutrients comparison - raw data values
| Nutrient | |
|
DV% diff. |
| Manganese | 0.646mg | 28% | |
| Vitamin C | 21mg | 36mg | 17% |
| Vitamin K | 19.8µg | 17% | |
| Vitamin B6 | 0.03mg | 0.23mg | 15% |
| Iron | 0.62mg | 1.6mg | 12% |
| Copper | 0.165mg | 0.061mg | 12% |
| Vitamin E | 1.17mg | 8% | |
| Fiber | 5.3g | 7g | 7% |
| Folate | 25µg | 6µg | 5% |
| Magnesium | 20mg | 5mg | 4% |
| Zinc | 0.53mg | 0.11mg | 4% |
| Vitamin B1 | 0.02mg | 0.07mg | 4% |
| Carbs | 9.61g | 18.4g | 3% |
| Potassium | 162mg | 280mg | 3% |
| Vitamin B2 | 0.026mg | 0.06mg | 3% |
| Vitamin B5 | 0.276mg | 0.14mg | 3% |
| Fructose | 2.4g | 3% | |
| Calories | 43kcal | 73kcal | 2% |
| Phosphorus | 22mg | 39mg | 2% |
| Vitamin A | 11µg | 30µg | 2% |
| Choline | 8.5mg | 2% | |
| Protein | 1.39g | 0.66g | 1% |
| Calcium | 29mg | 38mg | 1% |
| Vitamin B3 | 0.646mg | 0.5mg | 1% |
| Protein per 100 calories | 3.2g | 0.9g | N/A |
| Calories per 10 g protein | 309kcal | 1106kcal | N/A |
| Weight per 100 calories | 233g | 137g | N/A |
| Fats | 0.49g | 0.5g | 0% |
| Net carbs | 4.31g | 11.4g | N/A |
| Sugar | 4.88g | N/A | |
| Sodium | 1mg | 6mg | 0% |
| Selenium | 0.4µg | 0.6µg | 0% |
| Saturated fat | 0.014g | 0.023g | 0% |
| Monounsaturated fat | 0.047g | 0.08g | 0% |
| Polyunsaturated fat | 0.28g | 0.247g | 0% |
| Tryptophan | 0.013mg | 0% | |
| Threonine | 0.027mg | 0% | |
| Isoleucine | 0.027mg | 0% | |
| Leucine | 0.06mg | 0% | |
| Lysine | 0.026mg | 0% | |
| Methionine | 0.014mg | 0% | |
| Phenylalanine | 0.04mg | 0% | |
| Valine | 0.033mg | 0% | |
| Histidine | 0.015mg | 0% |
Fat Type Comparison
| Contains less Sat. FatSaturated fat | -39.1% |
| Contains more Poly. FatPolyunsaturated fat | +13.4% |
| Contains more Mono. FatMonounsaturated fat | +70.2% |
People also compare


References
All the values for which the sources are not specified explicitly are taken from FDA’s Food Central. The exact link to the food presented on this page can be found below.
- Blackberry - https://fdc.nal.usda.gov/fdc-app.html#/food-details/173946/nutrients
- Elderberry - https://fdc.nal.usda.gov/fdc-app.html#/food-details/171727/nutrients
All the Daily Values are presented for males aged 31-50, for 2000-calorie diets.