Blueberry vs. Grapefruit — Health Impact and Nutrition Comparison


Summary
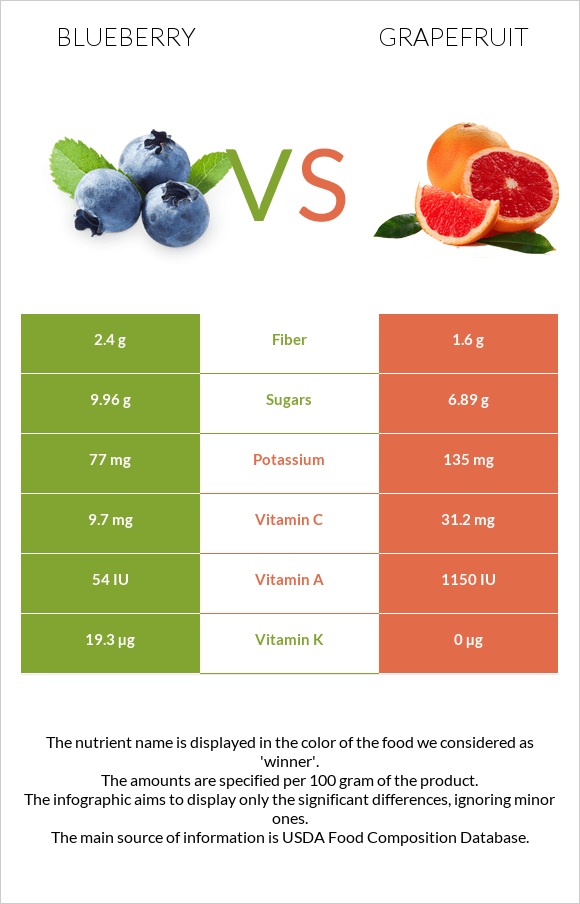
It is essential to check blueberry and grapefruit drug-food interactions. Blueberry is richer in vitamin K, and grapefruit is richer in vitamins A and C. Blueberry is higher in carbs, mostly glucose and fructose, while grapefruit is richer in sucrose.
Introduction
This article will compare blueberry and grapefruit, focusing on their nutritional content and health impacts.
We will compare 100g servings of raw types of blueberries and grapefruits.
Nutritional content comparison
84% of blueberry is water, and 88% of grapefruit is water.
This means that most fruits are water, and macronutrients, vitamins, and minerals are all distributed in the remaining.
As shown in the chart below, blueberry is slightly richer in carbohydrates. Please, read the more detailed information in the corresponding paragraphs.
Macronutrient Comparison
Contains
more
FatsFats
+135.7%
Contains
more
CarbsCarbs
+35.9%
Contains
more
OtherOther
+60.9%
Calories
They are low-calorie fruits. Blueberries are slightly higher in calories due to their higher carb content. It contains 57 calories per 100g, compared to 42 calories in grapefruit.
Carbs
Blueberry is higher in carbs by 1.5 times. Blueberry is 4 times higher in glucose and fructose than grapefruit. Instead, grapefruit is richer in sucrose.
Fiber
Blueberries are richer in fiber compared to grapefruit. Blueberry contains 2.4g of fiber, and grapefruit contains 1.6g.
Carbohydrate type comparison
Contains
more
StarchStarch
+∞%
Contains
more
GlucoseGlucose
+203.1%
Contains
more
FructoseFructose
+180.8%
Contains
more
SucroseSucrose
+3090.9%
Glycemic index
The glycemic index of blueberries is double of grapefruits. However, they are both classified as low glycemic index fruits.
Proteins and fats
They both contain negligible amounts of both proteins and fats.
Vitamins
Blueberries are richer in vitamin K. The amount of vitamin K in blueberries is remarkable. 300g of blueberries satisfy 50% of the daily recommended value of vitamin K. In comparison, grapefruits are richer in vitamins C and A.
The diagrams below display their vitamin distributions.
Vitamin Comparison
Contains
more
Vitamin EVitamin E
+338.5%
Contains
more
Vitamin B2Vitamin B2
+32.3%
Contains
more
Vitamin B3Vitamin B3
+104.9%
Contains
more
Vitamin KVitamin K
+∞%
Contains
more
Vitamin CVitamin C
+221.6%
Contains
more
Vitamin AVitamin A
+1833.3%
Contains
more
Vitamin B1Vitamin B1
+16.2%
Contains
more
Vitamin B5Vitamin B5
+111.3%
Contains
more
FolateFolate
+116.7%
Minerals
The mineral profiles of both fruits are not very remarkable. However, blueberries contain higher amounts of copper than grapefruit.
Below we can see the mineral distribution diagrams.
Mineral Comparison
Contains
more
IronIron
+250%
Contains
more
CopperCopper
+78.1%
Contains
more
ZincZinc
+128.6%
Contains
more
ManganeseManganese
+1427.3%
Contains
more
MagnesiumMagnesium
+50%
Contains
more
CalciumCalcium
+266.7%
Contains
more
PotassiumPotassium
+75.3%
Contains
more
PhosphorusPhosphorus
+50%
Contains
less
SodiumSodium
-100%
Health impacts
This section will focus on the health impact differences each food provides.
In the case of blueberry, it is richer in vitamin K and anthocyanins, which are the leading different health impact providers.
Anthocyanins in blueberries have antioxidative properties, and it decreases oxidative stress, reducing risks of cellular damage, reducing risks of cancers, and risks of neurodegenerative diseases (1)․
Vitamin K reduces osteoporosis risks and controls insulin level spikes, reducing risks of diabetes development (2)(3)․
On the other hand, we have grapefruits that provide positive health impacts, mainly through their richer content of vitamin C, furanocoumarins, and pectin.
Furanocoumarins have anticarcinogenic properties. In parallel with vitamin C, it provides antioxidative properties.
Pectins in grapefruits provide antidiabetic properties and reduce hyperglycemia. In addition, pectins reduce blood lipid levels reducing the risks of atherosclerosis (5)(6)(7)(8)․
Cardiovascular system
Blueberry may decrease the risk of coronary heart disease by decreasing total and LDL (bad cholesterol) concentrations in the blood (9). In contrast, grapefruit should not be consumed by people taking statins (Atorvastatin, Rosuvastatin, Fluvastatin, and Lovastatin), which are essential for decreasing cholesterol levels in the blood.
Unlike grapefruit, daily blueberry consumption may lower arterial stiffness, decreasing systolic and diastolic pressures, possibly due to increased nitric oxide (a vital vasodilator) production (10).
As a result, blueberry, unlike grapefruit, has a beneficial effect on the cardiovascular system.
Interactions
Spikes or fluctuations in vitamin K levels while taking anticoagulant drugs such as warfarin can interact. Thus, it is important to keep the vitamin K levels stable and not increase them suddenly by consuming high amounts of blueberries if taking anticoagulation medications (4)․
Grapefruits should not be taken with certain medications such as lipid-lowering and hypertension. They affect the elimination and absorption of the drug, increasing their side effects (11)․
References
- https://pubmed.ncbi.nlm.nih.gov/31329250/
- https://pubmed.ncbi.nlm.nih.gov/34439410/
- https://www.ncbi.nlm.nih.gov/pmc/articles/PMC4600246/
- https://pubmed.ncbi.nlm.nih.gov/15825811/
- https://pubmed.ncbi.nlm.nih.gov/15331129/
- https://pubmed.ncbi.nlm.nih.gov/2852566/
- https://pubmed.ncbi.nlm.nih.gov/16579728/
- https://pubmed.ncbi.nlm.nih.gov/28911545/
- https://www.cambridge.org/core/journals/british-journal-of-nutrition/article/effect-of-blueberry-feeding-on-plasma-lipids-in-pigs/FED4F7B9E214162AC3D02EF19592DDD9
- https://www.sciencedirect.com/science/article/abs/pii/S2212267214016335
- Grapefruit Juice and Some Drugs Don't Mix

Infographic
All nutrients comparison - raw data values
| Nutrient | |
|
DV% diff. |
| Vitamin C | 9.7mg | 31.2mg | 24% |
| Vitamin K | 19.3µg | 0µg | 16% |
| Manganese | 0.336mg | 0.022mg | 14% |
| Vitamin A | 3µg | 58µg | 6% |
| Fructose | 4.97g | 1.77g | 4% |
| Iron | 0.28mg | 0.08mg | 3% |
| Fiber | 2.4g | 1.6g | 3% |
| Copper | 0.057mg | 0.032mg | 3% |
| Vitamin E | 0.57mg | 0.13mg | 3% |
| Vitamin B5 | 0.124mg | 0.262mg | 3% |
| Calcium | 6mg | 22mg | 2% |
| Potassium | 77mg | 135mg | 2% |
| Folate | 6µg | 13µg | 2% |
| Calories | 57kcal | 42kcal | 1% |
| Carbs | 14.49g | 10.66g | 1% |
| Magnesium | 6mg | 9mg | 1% |
| Zinc | 0.16mg | 0.07mg | 1% |
| Phosphorus | 12mg | 18mg | 1% |
| Vitamin B1 | 0.037mg | 0.043mg | 1% |
| Vitamin B2 | 0.041mg | 0.031mg | 1% |
| Vitamin B3 | 0.418mg | 0.204mg | 1% |
| Polyunsaturated fat | 0.146g | 0.036g | 1% |
| Protein | 0.74g | 0.77g | 0% |
| Protein per 100 calories | 1.3g | 1.8g | N/A |
| Calories per 10 g protein | 770kcal | 545kcal | N/A |
| Weight per 100 calories | 175g | 238g | N/A |
| Fats | 0.33g | 0.14g | 0% |
| Net carbs | 12.09g | 9.06g | N/A |
| Sugar | 9.96g | 6.89g | N/A |
| Starch | 0.03g | 0g | 0% |
| Sodium | 1mg | 0mg | 0% |
| Selenium | 0.1µg | 0.1µg | 0% |
| Vitamin B6 | 0.052mg | 0.053mg | 0% |
| Choline | 6mg | 7.7mg | 0% |
| Saturated fat | 0.028g | 0.021g | 0% |
| Monounsaturated fat | 0.047g | 0.02g | 0% |
| Tryptophan | 0.003mg | 0.008mg | 0% |
| Threonine | 0.02mg | 0.013mg | 0% |
| Isoleucine | 0.023mg | 0.008mg | 0% |
| Leucine | 0.044mg | 0.015mg | 0% |
| Lysine | 0.013mg | 0.019mg | 0% |
| Methionine | 0.012mg | 0.007mg | 0% |
| Phenylalanine | 0.026mg | 0.013mg | 0% |
| Valine | 0.031mg | 0.015mg | 0% |
| Histidine | 0.011mg | 0.008mg | 0% |
Fat Type Comparison
| Contains more Mono. FatMonounsaturated fat | +135% |
| Contains more Poly. FatPolyunsaturated fat | +305.6% |
| Contains less Sat. FatSaturated fat | -25% |
People also compare


References
All the values for which the sources are not specified explicitly are taken from FDA’s Food Central. The exact link to the food presented on this page can be found below.
- Blueberry - https://fdc.nal.usda.gov/fdc-app.html#/food-details/171711/nutrients
- Grapefruit - https://fdc.nal.usda.gov/fdc-app.html#/food-details/174673/nutrients
All the Daily Values are presented for males aged 31-50, for 2000-calorie diets.