Grapefruit nutrition: calories, sugar, carbs, vitamin C, GI, fiber

Carbohydrates in Grapefruit
In this article, we will look at the nutrition of three types of grapefruit: raw pink and red grapefruit, raw white grapefruit, and grapefruit segments canned in juice.
Carbohydrates per 100g
A 100g red grapefruit is comprised of over 10% carbohydrates, containing 10.66g of carbs.
White grapefruit is lower in carbohydrates, containing 2g fewer carbs in the same serving size.
Grapefruit segments canned in juice contain more carbs than white grapefruits but fewer carbs than red ones.
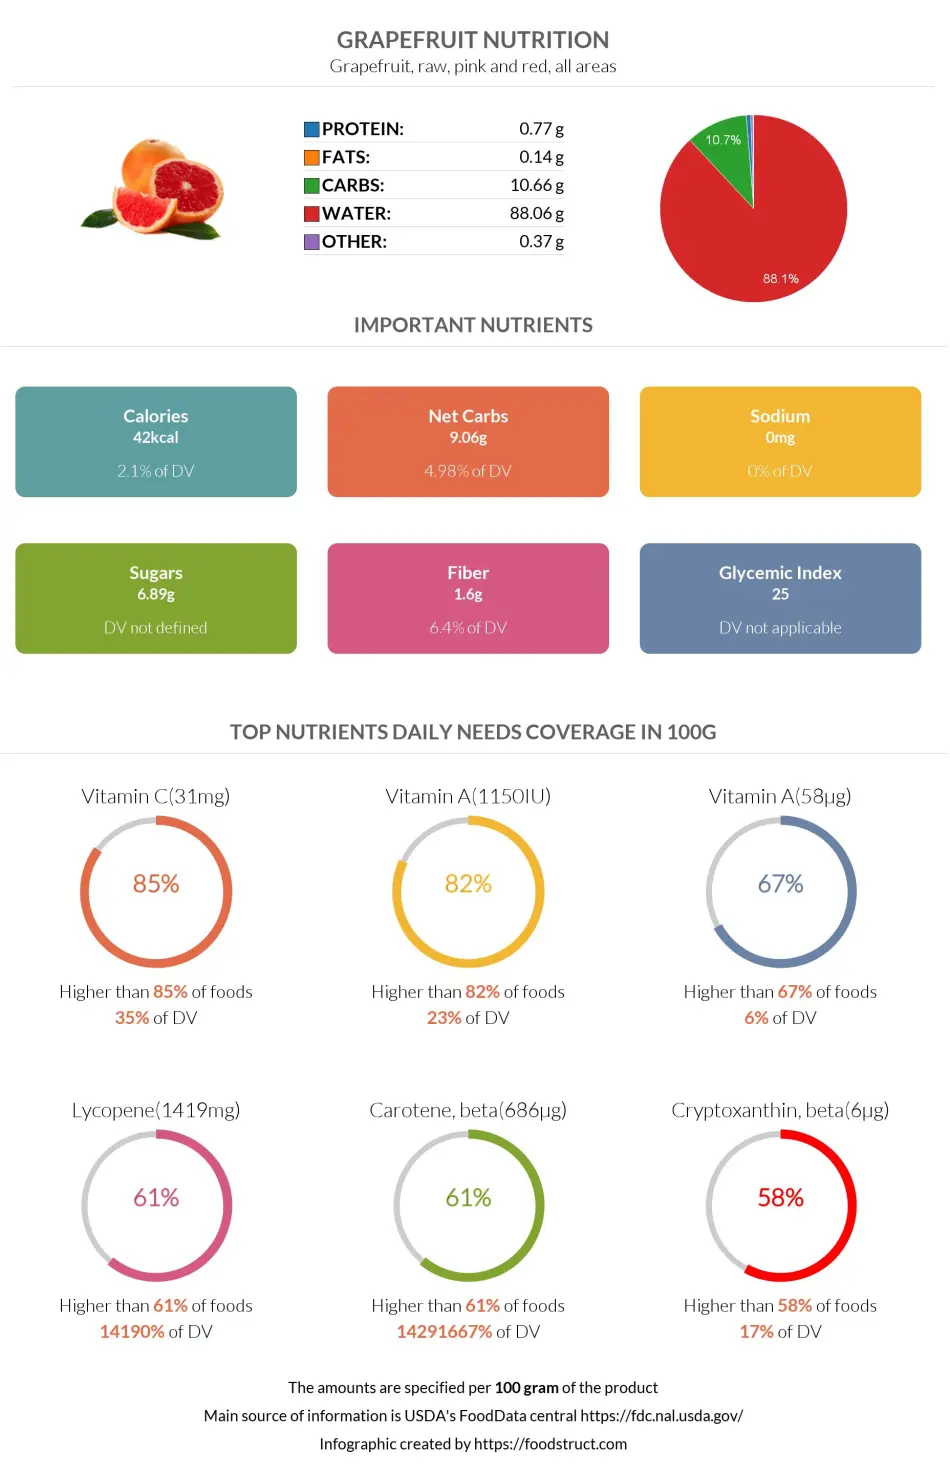
Macronutrients chart
Carbohydrates per Serving Size
The average serving size of grapefruits that a person eats in one sitting is 154g or half a medium-sized grapefruit.
One average serving size of red and pink grapefruit contains 16.4g of carbs.
Since we consider the average serving size to be the same for different kinds of grapefruits, the comparison results will naturally stay the same.
Carbohydrate Breakdown
The carbohydrate content of red grapefruit consists of 65% sugars, 15% fiber, and 20% other carbohydrates. In other words, red grapefruit contains 6.89g of sugars, 1.6g of fiber, and 2.17g of other carbohydrates.
The primary sugar in grapefruit is sucrose, making up more than half of the sugar content. The other two sugars in this fruit are glucose and fructose, in similar amounts.
Carbohydrate type breakdown
White grapefruit has a similar carbohydrate composition. However, grapefruit segments canned in juice are much lower in fiber, containing only 4% or 0.04g fiber.
Net Carbs
100g serving of grapefruit contains 9.06g of net carbs. Of this, 6.89g are made up of sugars, and the rest consists of other carbohydrates.
Soluble and Insoluble Fiber
The fiber content in grapefruit consists of 75% soluble (1.2g) and 25% insoluble fiber (0.4g) (1).
Soluble fiber slows down and improves digestion, while insoluble fiber helps with constipation.
Fiber content ratio for Grapefruit
Calories in Grapefruit
A 100g serving of red grapefruit provides 42 calories. This means that one average serving size, or half a grapefruit, contains 65 calories.
White grapefruit and grapefruit segments canned in juice are relatively lower in calories.
A 100g serving size of grapefruits provides only 2% of your daily calorie intake needs.
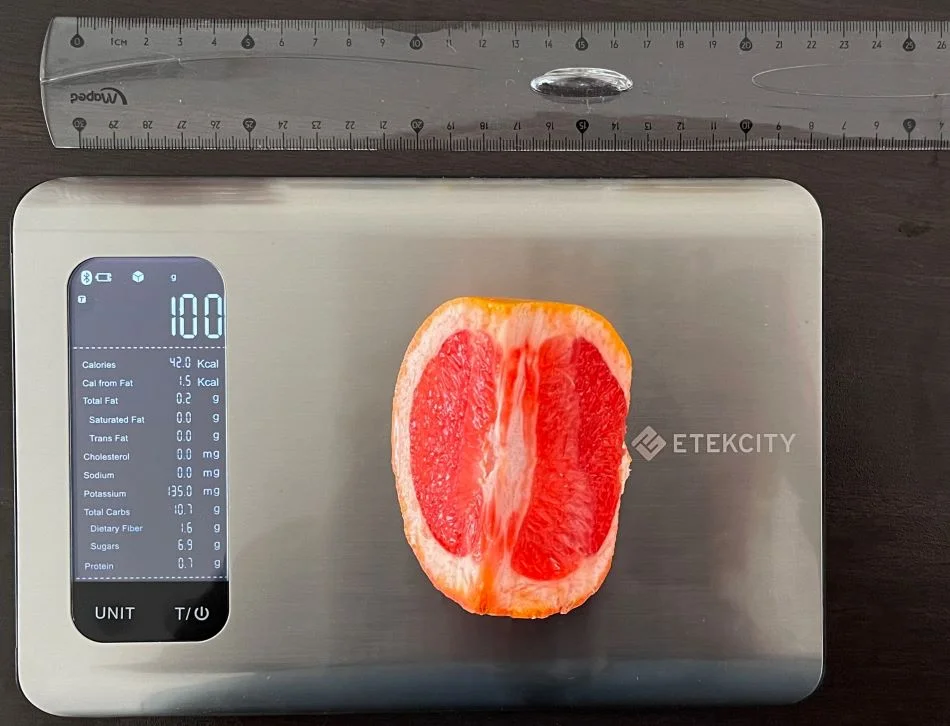
What Do 42 Calories or 100 Grams of Grapefruit Look Like?
Our team measured what 100 grams of grapefruit looks like to help you visualize its weight and calories. As you can see from the picture below, about one-third of grapefruit comprised 100 grams or 42 calories, which means one whole grapefruit is about 300 grams or about 126 calories.
Remember that calorie numbers can vary depending on the grapefruits' size and ripeness.
Comparison to Other Fruits
Grapefruit is often compared to other popular citrus fruits, such as orange. To read more about this, visit our "Grapefruit vs. Orange" full comparison page.
In the table below, you can look at how grapefruits compare to other fruits regarding calorie content.
| Food | Calories per serving | Calories per 100g |
| Grapefruit | 65 | 42 |
| Pomelo | 72 (1 cup, 190g) | 38 |
| Orange | 62 (1 fruit, 131g) | 47 |
| Grape | 62 (1 cup, 92g) | 67 |
| Mandarin Orange | 58 (109g) | 53 |
| Lemon | 19 (58g) | 29 |
Burning Estimates
Using a method called Met or Metabolic Equivalent of a Task, we have calculated how much physical activity will burn the number of calories (65 cal) provided by one average serving size of a grapefruit (2, 3).
| 60kg person | 80kg person | 100kg person | |
| Walking | 19 min | 14 min | 11 min |
| Running | 6 min | 5 min | 4 min |
| Cycling | 9 min | 7 min | 6 min |
| Dancing | 9 min | 7 min | 6 min |
References
- https://sci.washington.edu/info/forums/reports/FiberFacts.pdf
- https://www.ncbi.nlm.nih.gov/pmc/articles/PMC4428382/
- 2011 Compendium of Physical Activities

Top nutrition facts for Grapefruit
| Sugar | 6.89 g |
| Calories ⓘ Calories for selected serving | 42 kcal |
|
Glycemic index ⓘ
Source:
Check out our Glycemic index chart page for the full list.
|
25 (low) |
| Glycemic load ⓘ Glycemic Load (GL) is a metric that measures both the quality (Glycemic Index) and quantity of carbohydrates in a specific serving of food to estimate its impact on blood sugar levels. It is calculated as: (GI × Carbs in grams) / 100. | 3 (low) |
| Net carbs ⓘ Net Carbs = Total Carbohydrates – Fiber – Sugar Alcohols | 9 g |
| Default serving size ⓘ Serving sizes are mostly taken from FDA's Reference Amounts Customarily Consumed (RACCs) | 1 NLEA serving (154 g) |
| Acidity (Based on PRAL) ⓘ PRAL (Potential renal acid load) is calculated using a formula. On the PRAL scale the higher the positive value, the more is the acidifying effect on the body. The lower the negative value, the higher the alkalinity of the food. 0 is neutral. | -2.3 (alkaline) |
| Oxalates | 2 mg ⓘ https://repository.kulib.kyoto-u.ac.jp/dspace/bitstream/2433/118142/1/30_305.pdf |
Grapefruit calories (kcal)
| Calories for different serving sizes of grapefruit | Calories | Weight |
|---|---|---|
| Calories in 100 grams | 42 | |
| Calories in 1 NLEA serving | 65 | 154 g |
| Calories in 1 cup sections, with juice | 97 | 230 g |
Extra Nutrition facts for Grapefruit
| Protein per 100 calories ⓘ Shows how many grams of protein you get from 100 calories of this food, calculated as (protein in g ÷ calories) × 100. | 1.8 g |
| Calories per 10 g protein ⓘ Shows how many calories you need to eat from this food to get 10 g of protein, calculated as (calories ÷ protein in g) × 10. | 545 kcal |
| Weight per 100 calories ⓘ Shows how many grams of this food equal 100 kcal—higher grams mean a larger portion for the same calories. | 238 g |
Grapefruit Glycemic index (GI)
Grapefruit Glycemic load (GL)
Mineral coverage chart
Mineral chart - relative view
Vitamin coverage chart
Vitamin chart - relative view
Protein quality breakdown
Fat type information
All nutrients for Grapefruit per 100g
| Nutrient | Value | DV% | In TOP % of foods | Comparison |
| Vitamin A | 58µg | 6% | 16% | |
| Calories | 42kcal | 2% | 91% |
1.1 times less than Orange
|
| Protein per 100 calories | 1.8g | N/A | 74% | |
| Calories per 10 g protein | 545kcal | N/A | 23% | |
| Protein | 0.77g | 2% | 88% |
3.7 times less than Broccoli
|
| Weight per 100 calories | 238g | N/A | 10% | |
| Fats | 0.14g | 0% | 91% |
237.9 times less than Cheese
|
| Vitamin C | 31mg | 35% | 6% |
1.7 times less than Lemon
|
| Carbs | 11g | 4% | 48% |
2.6 times less than Rice
|
| Net carbs | 9.1g | N/A | 48% |
6 times less than Chocolate
|
| Cholesterol | 0mg | 0% | 100% |
N/A
|
| Vitamin D* | 0 IU | 0% | 100% |
N/A
|
| Vitamin D | 0µg | 0% | 100% |
N/A
|
| Magnesium | 9mg | 2% | 78% |
15.6 times less than Almonds
|
| Calcium | 22mg | 2% | 48% |
5.7 times less than Milk
|
| Potassium | 135mg | 4% | 70% |
1.1 times less than Cucumber
|
| Iron | 0.08mg | 1% | 92% |
32.5 times less than Beef broiled
|
| Sugar | 6.9g | N/A | 24% |
1.3 times less than Coca-Cola
|
| Fiber | 1.6g | 6% | 35% |
1.5 times less than Orange
|
| Copper | 0.03mg | 4% | 74% |
4.4 times less than Shiitake
|
| Zinc | 0.07mg | 1% | 85% |
90.1 times less than Beef broiled
|
| Starch | 0g | 0% | 100% |
N/A
|
| Phosphorus | 18mg | 3% | 83% |
10.1 times less than Chicken meat
|
| Sodium | 0mg | 0% | 100% |
N/A
|
| Vitamin E | 0.13mg | 1% | 50% |
11.2 times less than Kiwi
|
| Manganese | 0.02mg | 1% | 51% | |
| Selenium | 0.1µg | 0% | 77% | |
| Vitamin B1 | 0.04mg | 4% | 68% |
6.2 times less than Pea raw
|
| Vitamin B2 | 0.03mg | 2% | 80% |
4.2 times less than Avocado
|
| Vitamin B3 | 0.2mg | 1% | 80% |
46.9 times less than Turkey meat
|
| Vitamin B5 | 0.26mg | 5% | 51% |
4.3 times less than Sunflower seeds
|
| Vitamin B6 | 0.05mg | 4% | 67% |
2.2 times less than Oats
|
| Vitamin B12 | 0µg | 0% | 100% |
N/A
|
| Vitamin K | 0µg | 0% | 100% |
N/A
|
| Folate | 13µg | 3% | 42% |
4.7 times less than Brussels sprouts
|
| Trans fat | 0g | N/A | 100% |
N/A
|
| Saturated fat | 0.02g | 0% | 87% |
280.7 times less than Beef broiled
|
| Choline | 7.7mg | 1% | 43% | |
| Monounsaturated fat | 0.02g | N/A | 82% |
490 times less than Avocado
|
| Polyunsaturated fat | 0.04g | N/A | 85% |
1310.4 times less than Walnut
|
| Tryptophan | 0.01mg | 0% | 55% |
38.1 times less than Chicken meat
|
| Threonine | 0.01mg | 0% | 57% |
55.4 times less than Beef broiled
|
| Isoleucine | 0.01mg | 0% | 57% |
114.3 times less than Salmon raw
|
| Leucine | 0.02mg | 0% | 57% |
162.1 times less than Tuna Bluefin
|
| Lysine | 0.02mg | 0% | 57% |
23.8 times less than Tofu
|
| Methionine | 0.01mg | 0% | 56% |
13.7 times less than Quinoa
|
| Phenylalanine | 0.01mg | 0% | 57% |
51.4 times less than Egg
|
| Valine | 0.02mg | 0% | 57% |
135.3 times less than Soybean raw
|
| Histidine | 0.01mg | 0% | 57% |
93.6 times less than Turkey meat
|
| Fructose | 1.8g | 2% | 4% |
3.3 times less than Apple
|
| Caffeine | 0mg | 0% | 100% | |
| Omega-3 - EPA | 0g | N/A | 100% |
N/A
|
| Omega-3 - DHA | 0g | N/A | 100% |
N/A
|
| Omega-3 - DPA | 0g | N/A | 100% |
N/A
|
Check out similar food or compare with current
NUTRITION FACTS LABEL
Serving Size ______________
Health checks
Grapefruit nutrition infographic
References
All the values for which the sources are not specified explicitly are taken from FDA’s Food Central. The exact link to the food presented on this page can be found below.