Differences between brie and black tea Black tea contains less vitamin B12, vitamin B2, phosphorus, selenium, zinc, calcium, and vitamin B6 than brie. Brie's daily need coverage for saturated fat is 87% higher. The amount of cholesterol in black tea is lower. The food types used in this comparison are Cheese, brie and Beverages, tea, black, brewed, prepared with tap water .
Infographic
Mineral Comparison
Mineral comparison score is based on the number of minerals by which one or the other food is richer. The "coverage" charts below show how much of the daily needs can be covered by 300 grams of the food.
8
100 g
300 g
1 cubic inch - 17g 1 oz - 28.35g 1 package (4.5 oz) - 128g 1 cup, sliced - 144g 1 cup, melted - 240g
Magnesium
Magnesium
Calcium
Calcium
Potassium
Potassium
Iron
Iron
Copper
Copper
Zinc
Zinc
Phosphorus
Phosphorus
Sodium
Sodium
Manganese
Manganese
Selenium
Selenium
14%
55%
13%
19%
6.3%
65%
81%
82%
4.4%
79%
2
100 g
300 g
1 fl oz - 29.6g 6 fl oz - 178g 1 cup (8 fl oz) - 237g
Magnesium
Magnesium
Calcium
Calcium
Potassium
Potassium
Iron
Iron
Copper
Copper
Zinc
Zinc
Phosphorus
Phosphorus
Sodium
Sodium
Manganese
Manganese
Selenium
Selenium
2.1%
0%
3.3%
0.75%
3.3%
0.55%
0.43%
0.39%
29%
0%
Vitamin Comparison
Vitamin comparison score is based on the number of vitamins by which one or the other food is richer. The "coverage" charts below show how much of the daily needs can be covered by 300 grams of the food.
11
100 g
300 g
1 cubic inch - 17g 1 oz - 28.35g 1 package (4.5 oz) - 128g 1 cup, sliced - 144g 1 cup, melted - 240g
Vitamin C
Vit. C
Vitamin D
Vit. D
Vitamin A
Vit. A
Vitamin E
Vit. E
Vitamin B1
Vit. B1
Vitamin B2
Vit. B2
Vitamin B3
Vit. B3
Vitamin B5
Vit. B5
Vitamin B6
Vit. B6
Vitamin B12
Vit. B12
Vitamin K
Vit. K
Folate
Folate
0%
7.5%
58%
4.8%
18%
120%
7.1%
41%
54%
206%
5.8%
49%
0
100 g
300 g
1 fl oz - 29.6g 6 fl oz - 178g 1 cup (8 fl oz) - 237g
Vitamin C
Vit. C
Vitamin D
Vit. D
Vitamin A
Vit. A
Vitamin E
Vit. E
Vitamin B1
Vit. B1
Vitamin B2
Vit. B2
Vitamin B3
Vit. B3
Vitamin B5
Vit. B5
Vitamin B6
Vit. B6
Vitamin B12
Vit. B12
Vitamin K
Vit. K
Folate
Folate
0%
0%
0%
0%
0%
3.2%
0%
0.66%
0%
0%
0%
3.8%
All nutrients comparison - raw data values
Nutrient
DV% diff.
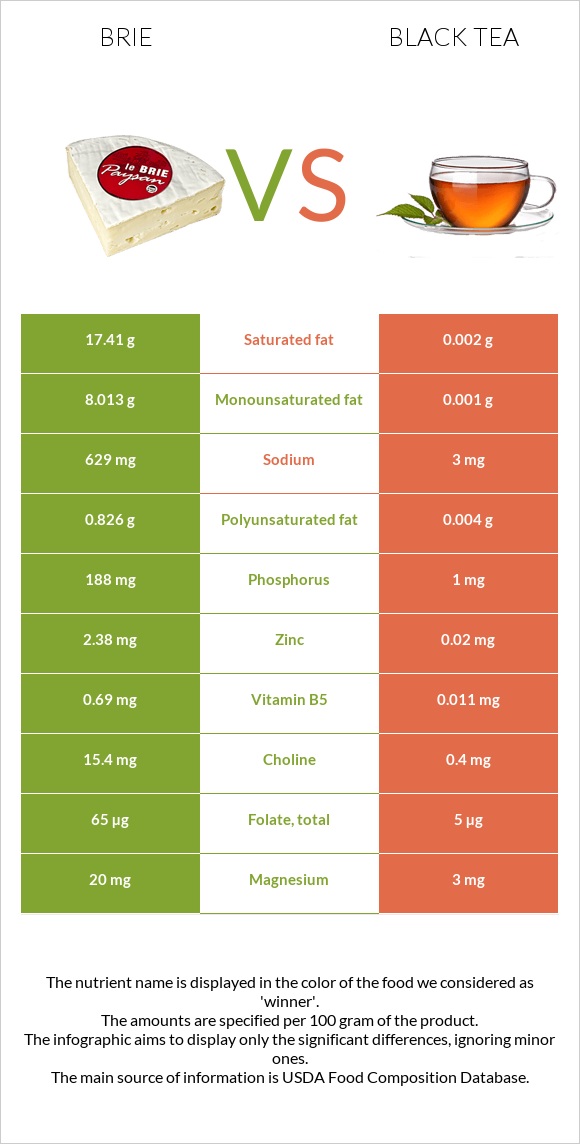
Saturated fat
17.41g
0.002g
79%
Vitamin B12
1.65µg
0µg
69%
Fats
27.68g
0g
43%
Protein
20.75g
0g
42%
Vitamin B2
0.52mg
0.014mg
39%
Cholesterol
100mg
0mg
33%
Phosphorus
188mg
1mg
27%
Sodium
629mg
3mg
27%
Selenium
14.5µg
0µg
26%
Zinc
2.38mg
0.02mg
21%
Monounsaturated fat
8.013g
0.001g
20%
Vitamin A
174µg
0µg
19%
Calcium
184mg
0mg
18%
Vitamin B6
0.235mg
0mg
18%
Calories
334kcal
1kcal
17%
Folate
65µg
5µg
15%
Vitamin B5
0.69mg
0.011mg
14%
Manganese
0.034mg
0.219mg
8%
Iron
0.5mg
0.02mg
6%
Vitamin B1
0.07mg
0mg
6%
Polyunsaturated fat
0.826g
0.004g
5%
Caffeine
0mg
20mg
5%
Magnesium
20mg
3mg
4%
Vitamin D*
20 IU
0 IU
3%
Vitamin D
0.5µg
0µg
3%
Potassium
152mg
37mg
3%
Choline
15.4mg
0.4mg
3%
Vitamin E
0.24mg
0mg
2%
Vitamin B3
0.38mg
0mg
2%
Vitamin K
2.3µg
0µg
2%
Copper
0.019mg
0.01mg
1%
Protein per 100 calories
6.2g
0g
N/A
Calories per 10 g protein
161kcal
N/A
Weight per 100 calories
30g
10000g
N/A
Unsaturated / Saturated Fat ratio
0.51
2.5
N/A
Net carbs
0.45g
0.3g
N/A
Carbs
0.45g
0.3g
0%
Sugar
0.45g
0g
N/A
Tryptophan
0.322mg
0mg
0%
Threonine
0.751mg
0mg
0%
Isoleucine
1.015mg
0mg
0%
Leucine
1.929mg
0mg
0%
Lysine
1.851mg
0mg
0%
Methionine
0.592mg
0mg
0%
Phenylalanine
1.158mg
0mg
0%
Valine
1.34mg
0mg
0%
Histidine
0.716mg
0mg
0%
Macronutrient Comparison
Macronutrient breakdown side-by-side comparison
4
21%
28%
48%
3%
Protein:
20.75 g
Fats:
27.68 g
Carbs:
0.45 g
Water:
48.42 g
Other:
2.7 g
1
100%
Protein:
0 g
Fats:
0 g
Carbs:
0.3 g
Water:
99.7 g
Other:
0 g
Contains
more
Protein Protein
+∞%
Contains
more
Fats Fats
+∞%
Contains
more
Carbs Carbs
+50%
Contains
more
Other Other
+∞%
Contains
more
Water Water
+105.9%
Fat Type Comparison
Fat type breakdown side-by-side comparison
2
66%
31%
3%
Saturated fat:
Sat. Fat
17.41 g
Monounsaturated fat:
Mono. Fat
8.013 g
Polyunsaturated fat:
Poly. Fat
0.826 g
1
29%
14%
57%
Saturated fat:
Sat. Fat
0.002 g
Monounsaturated fat:
Mono. Fat
0.001 g
Polyunsaturated fat:
Poly. Fat
0.004 g
Contains
more
Mono. Fat Monounsaturated fat
+801200%
Contains
more
Poly. Fat Polyunsaturated fat
+20550%
Contains
less
Sat. Fat Saturated fat
-100%