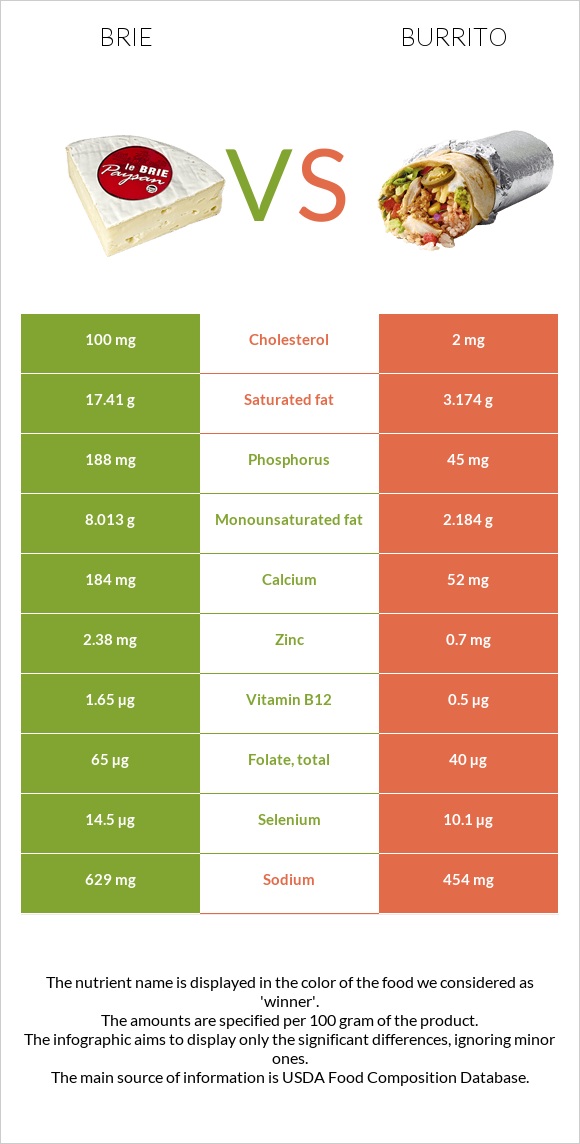
What are the main differences between brie and burrito? Brie is richer in vitamin B12, phosphorus, vitamin B2, and zinc, yet burrito is richer in iron, vitamin B1, copper, and manganese. Brie's daily need coverage for saturated fat is 71% higher. Brie has 50 times more cholesterol than burrito. Brie has 100mg of cholesterol, while burrito has 2mg. Brie has a lower glycemic index than burrito. We used Cheese, brie and Fast foods, burrito, with beans types in this comparison.
Infographic
Mineral Comparison
Mineral comparison score is based on the number of minerals by which one or the other food is richer. The "coverage" charts below show how much of the daily needs can be covered by 300 grams of the food.
4
100 g
300 g
1 cubic inch - 17g 1 oz - 28.35g 1 package (4.5 oz) - 128g 1 cup, sliced - 144g 1 cup, melted - 240g
Magnesium
Magnesium
Calcium
Calcium
Potassium
Potassium
Iron
Iron
Copper
Copper
Zinc
Zinc
Phosphorus
Phosphorus
Sodium
Sodium
Manganese
Manganese
Selenium
Selenium
14%
55%
13%
19%
6.3%
65%
81%
82%
4.4%
79%
6
100 g
300 g
2 pieces - 217g
Magnesium
Magnesium
Calcium
Calcium
Potassium
Potassium
Iron
Iron
Copper
Copper
Zinc
Zinc
Phosphorus
Phosphorus
Sodium
Sodium
Manganese
Manganese
Selenium
Selenium
29%
16%
27%
78%
58%
19%
19%
59%
52%
55%
Vitamin Comparison
Vitamin comparison score is based on the number of vitamins by which one or the other food is richer. The "coverage" charts below show how much of the daily needs can be covered by 300 grams of the food.
8
100 g
300 g
1 cubic inch - 17g 1 oz - 28.35g 1 package (4.5 oz) - 128g 1 cup, sliced - 144g 1 cup, melted - 240g
Vitamin C
Vit. C
Vitamin D
Vit. D
Vitamin A
Vit. A
Vitamin E
Vit. E
Vitamin B1
Vit. B1
Vitamin B2
Vit. B2
Vitamin B3
Vit. B3
Vitamin B5
Vit. B5
Vitamin B6
Vit. B6
Vitamin B12
Vit. B12
Vitamin K
Vit. K
Folate
Folate
0%
7.5%
58%
4.8%
18%
120%
7.1%
41%
54%
206%
5.8%
49%
4
100 g
300 g
2 pieces - 217g
Vitamin C
Vit. C
Vitamin D
Vit. D
Vitamin A
Vit. A
Vitamin E
Vit. E
Vitamin B1
Vit. B1
Vitamin B2
Vit. B2
Vitamin B3
Vit. B3
Vitamin B5
Vit. B5
Vitamin B6
Vit. B6
Vitamin B12
Vit. B12
Vitamin K
Vit. K
Folate
Folate
3%
0%
0%
0%
73%
65%
35%
55%
32%
63%
0%
30%
All nutrients comparison - raw data values
Nutrient
DV% diff.
Saturated fat
17.41g
3.174g
65%
Vitamin B12
1.65µg
0.5µg
48%
Fats
27.68g
6.22g
33%
Cholesterol
100mg
2mg
33%
Protein
20.75g
6.48g
29%
Iron
0.5mg
2.08mg
20%
Phosphorus
188mg
45mg
20%
Vitamin A
174µg
19%
Vitamin B1
0.07mg
0.29mg
18%
Vitamin B2
0.52mg
0.28mg
18%
Copper
0.019mg
0.174mg
17%
Manganese
0.034mg
0.4mg
16%
Zinc
2.38mg
0.7mg
15%
Monounsaturated fat
8.013g
2.184g
15%
Calcium
184mg
52mg
13%
Carbs
0.45g
32.92g
11%
Vitamin B3
0.38mg
1.87mg
9%
Sodium
629mg
454mg
8%
Selenium
14.5µg
10.1µg
8%
Vitamin B6
0.235mg
0.14mg
7%
Calories
334kcal
206kcal
6%
Folate
65µg
40µg
6%
Magnesium
20mg
40mg
5%
Vitamin B5
0.69mg
0.92mg
5%
Potassium
152mg
301mg
4%
Vitamin D*
20 IU
3%
Vitamin D
0.5µg
3%
Vitamin E
0.24mg
2%
Vitamin K
2.3µg
2%
Choline
15.4mg
26.8mg
2%
Polyunsaturated fat
0.826g
0.551g
2%
Vitamin C
0mg
0.9mg
1%
Protein per 100 calories
6.2g
3.1g
N/A
Calories per 10 g protein
161kcal
318kcal
N/A
Weight per 100 calories
30g
49g
N/A
Unsaturated / Saturated Fat ratio
0.51
0.86
N/A
Net carbs
0.45g
32.92g
N/A
Sugar
0.45g
N/A
Tryptophan
0.322mg
0.079mg
0%
Threonine
0.751mg
0.244mg
0%
Isoleucine
1.015mg
0.27mg
0%
Leucine
1.929mg
0.504mg
0%
Lysine
1.851mg
0.343mg
0%
Methionine
0.592mg
0.107mg
0%
Phenylalanine
1.158mg
0.351mg
0%
Valine
1.34mg
0.319mg
0%
Histidine
0.716mg
0.172mg
0%
Macronutrient Comparison
Macronutrient breakdown side-by-side comparison
3
21%
28%
48%
3%
Protein:
20.75 g
Fats:
27.68 g
Carbs:
0.45 g
Water:
48.42 g
Other:
2.7 g
2
6%
6%
33%
53%
2%
Protein:
6.48 g
Fats:
6.22 g
Carbs:
32.92 g
Water:
52.53 g
Other:
1.85 g
Contains
more
Protein Protein
+220.2%
Contains
more
Fats Fats
+345%
Contains
more
Other Other
+45.9%
Contains
more
Carbs Carbs
+7215.6%
Fat Type Comparison
Fat type breakdown side-by-side comparison
2
66%
31%
3%
Saturated fat:
Sat. Fat
17.41 g
Monounsaturated fat:
Mono. Fat
8.013 g
Polyunsaturated fat:
Poly. Fat
0.826 g
1
54%
37%
9%
Saturated fat:
Sat. Fat
3.174 g
Monounsaturated fat:
Mono. Fat
2.184 g
Polyunsaturated fat:
Poly. Fat
0.551 g
Contains
more
Mono. Fat Monounsaturated fat
+266.9%
Contains
more
Poly. Fat Polyunsaturated fat
+49.9%
Contains
less
Sat. Fat Saturated fat
-81.8%