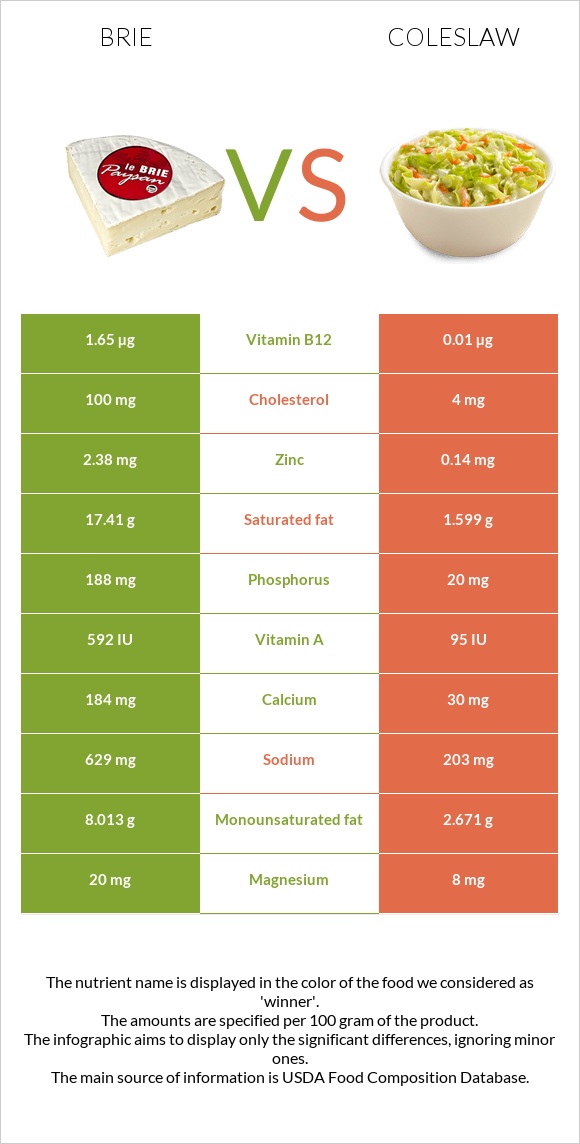
Summary of differences between brie and coleslaw Brie has more vitamin B12, vitamin B2, phosphorus, zinc, and calcium; however, coleslaw is higher in vitamin K and vitamin C. Brie covers your daily need for saturated fat, 79% more than coleslaw. Brie has 165 times more vitamin B12 than coleslaw. While brie has 1.65µg of vitamin B12, coleslaw has only 0.01µg. Coleslaw has less cholesterol. The glycemic index of coleslaw is higher. These are the specific foods used in this comparison Cheese, brie and Fast foods, coleslaw .
Infographic
Mineral Comparison
Mineral comparison score is based on the number of minerals by which one or the other food is richer. The "coverage" charts below show how much of the daily needs can be covered by 300 grams of the food.
8
100 g
300 g
1 cubic inch - 17g 1 oz - 28.35g 1 package (4.5 oz) - 128g 1 cup, sliced - 144g 1 cup, melted - 240g
Magnesium
Magnesium
Calcium
Calcium
Potassium
Potassium
Iron
Iron
Copper
Copper
Zinc
Zinc
Phosphorus
Phosphorus
Sodium
Sodium
Manganese
Manganese
Selenium
Selenium
14%
55%
13%
19%
6.3%
65%
81%
82%
4.4%
79%
2
100 g
300 g
1 package - 116g 1 cup - 191g
Magnesium
Magnesium
Calcium
Calcium
Potassium
Potassium
Iron
Iron
Copper
Copper
Zinc
Zinc
Phosphorus
Phosphorus
Sodium
Sodium
Manganese
Manganese
Selenium
Selenium
5.7%
9%
11%
8.3%
5%
3.8%
8.6%
26%
13%
0%
Vitamin Comparison
Vitamin comparison score is based on the number of vitamins by which one or the other food is richer. The "coverage" charts below show how much of the daily needs can be covered by 300 grams of the food.
9
100 g
300 g
1 cubic inch - 17g 1 oz - 28.35g 1 package (4.5 oz) - 128g 1 cup, sliced - 144g 1 cup, melted - 240g
Vitamin C
Vit. C
Vitamin D
Vit. D
Vitamin A
Vit. A
Vitamin E
Vit. E
Vitamin B1
Vit. B1
Vitamin B2
Vit. B2
Vitamin B3
Vit. B3
Vitamin B5
Vit. B5
Vitamin B6
Vit. B6
Vitamin B12
Vit. B12
Vitamin K
Vit. K
Folate
Folate
0%
7.5%
58%
4.8%
18%
120%
7.1%
41%
54%
206%
5.8%
49%
3
100 g
300 g
1 package - 116g 1 cup - 191g
Vitamin C
Vit. C
Vitamin D
Vit. D
Vitamin A
Vit. A
Vitamin E
Vit. E
Vitamin B1
Vit. B1
Vitamin B2
Vit. B2
Vitamin B3
Vit. B3
Vitamin B5
Vit. B5
Vitamin B6
Vit. B6
Vitamin B12
Vit. B12
Vitamin K
Vit. K
Folate
Folate
49%
0%
9.3%
11%
6.5%
4.6%
3.9%
15%
26%
1.3%
177%
0%
All nutrients comparison - raw data values
Nutrient
DV% diff.
Saturated fat
17.41g
1.599g
72%
Vitamin B12
1.65µg
0.01µg
68%
Vitamin K
2.3µg
70.9µg
57%
Protein
20.75g
0.95g
40%
Vitamin B2
0.52mg
0.02mg
38%
Cholesterol
100mg
4mg
32%
Polyunsaturated fat
0.826g
5.348g
30%
Fats
27.68g
9.91g
27%
Selenium
14.5µg
26%
Phosphorus
188mg
20mg
24%
Zinc
2.38mg
0.14mg
20%
Sodium
629mg
203mg
19%
Vitamin C
0mg
14.6mg
16%
Vitamin A
174µg
28µg
16%
Folate
65µg
16%
Calcium
184mg
30mg
15%
Monounsaturated fat
8.013g
2.671g
13%
Calories
334kcal
153kcal
9%
Vitamin B5
0.69mg
0.246mg
9%
Vitamin B6
0.235mg
0.112mg
9%
Fiber
0g
1.9g
8%
Carbs
0.45g
14.89g
5%
Iron
0.5mg
0.22mg
4%
Vitamin B1
0.07mg
0.026mg
4%
Vitamin D*
20 IU
3%
Vitamin D
0.5µg
3%
Magnesium
20mg
8mg
3%
Manganese
0.034mg
0.102mg
3%
Choline
15.4mg
3%
Vitamin E
0.24mg
0.54mg
2%
Fructose
1.44g
2%
Potassium
152mg
129mg
1%
Vitamin B3
0.38mg
0.206mg
1%
Protein per 100 calories
6.2g
0.62g
N/A
Calories per 10 g protein
161kcal
1611kcal
N/A
Weight per 100 calories
30g
65g
N/A
Unsaturated / Saturated Fat ratio
0.51
5
N/A
Net carbs
0.45g
12.99g
N/A
Sugar
0.45g
12.19g
N/A
Copper
0.019mg
0.015mg
0%
Trans fat
0.037g
N/A
Tryptophan
0.322mg
0%
Threonine
0.751mg
0%
Isoleucine
1.015mg
0%
Leucine
1.929mg
0%
Lysine
1.851mg
0%
Methionine
0.592mg
0%
Phenylalanine
1.158mg
0%
Valine
1.34mg
0%
Histidine
0.716mg
0%
Omega-3 - EPA
0g
0.006g
N/A
Omega-3 - DHA
0g
0.001g
N/A
Omega-3 - ALA
0.279g
N/A
Omega-3 - Eicosatrienoic acid
0.001g
N/A
Omega-6 - Gamma-linoleic acid
0.024g
N/A
Omega-6 - Dihomo-gamma-linoleic acid
0.006g
N/A
Omega-6 - Eicosadienoic acid
0.002g
N/A
Omega-6 - Linoleic acid
4.979g
N/A
Macronutrient Comparison
Macronutrient breakdown side-by-side comparison
3
21%
28%
48%
3%
Protein:
20.75 g
Fats:
27.68 g
Carbs:
0.45 g
Water:
48.42 g
Other:
2.7 g
2
10%
15%
73%
Protein:
0.95 g
Fats:
9.91 g
Carbs:
14.89 g
Water:
73.42 g
Other:
0.83 g
Contains
more
Protein Protein
+2084.2%
Contains
more
Fats Fats
+179.3%
Contains
more
Other Other
+225.3%
Contains
more
Carbs Carbs
+3208.9%
Contains
more
Water Water
+51.6%
Fat Type Comparison
Fat type breakdown side-by-side comparison
1
66%
31%
3%
Saturated fat:
Sat. Fat
17.41 g
Monounsaturated fat:
Mono. Fat
8.013 g
Polyunsaturated fat:
Poly. Fat
0.826 g
2
17%
28%
56%
Saturated fat:
Sat. Fat
1.599 g
Monounsaturated fat:
Mono. Fat
2.671 g
Polyunsaturated fat:
Poly. Fat
5.348 g
Contains
more
Mono. Fat Monounsaturated fat
+200%
Contains
less
Sat. Fat Saturated fat
-90.8%
Contains
more
Poly. Fat Polyunsaturated fat
+547.5%