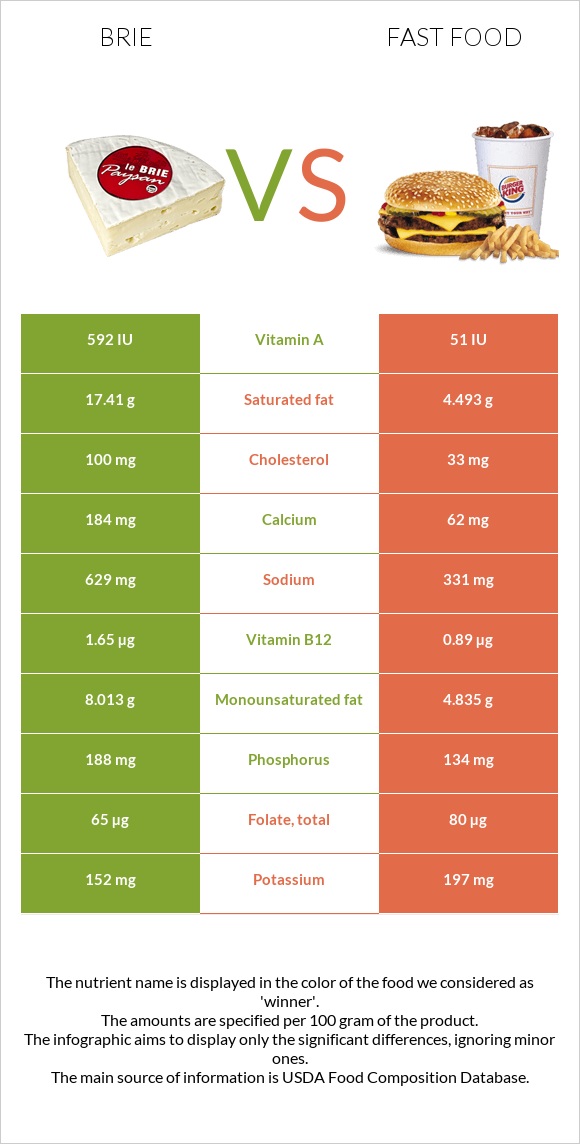
Summary of differences between brie and fast food Brie has more vitamin B12, calcium, and vitamin B2; however, fast food is higher in vitamin B3, iron, vitamin B1, and manganese. Brie covers your daily need for saturated fat, 65% more than fast food. Brie has 3 times more cholesterol than fast food. While brie has 100mg of cholesterol, fast food has only 33mg. Fast food has less saturated fat. The glycemic index of fast food is higher. These are the specific foods used in this comparison Cheese, brie and Fast foods, hamburger; single, regular patty; plain .
Infographic
Mineral Comparison
Mineral comparison score is based on the number of minerals by which one or the other food is richer. The "coverage" charts below show how much of the daily needs can be covered by 300 grams of the food.
2
100 g
300 g
1 cubic inch - 17g 1 oz - 28.35g 1 package (4.5 oz) - 128g 1 cup, sliced - 144g 1 cup, melted - 240g
Magnesium
Magnesium
Calcium
Calcium
Potassium
Potassium
Iron
Iron
Copper
Copper
Zinc
Zinc
Phosphorus
Phosphorus
Sodium
Sodium
Manganese
Manganese
Selenium
Selenium
14%
55%
13%
19%
6.3%
65%
81%
82%
4.4%
79%
7
100 g
300 g
1 sandwich - 78g
Magnesium
Magnesium
Calcium
Calcium
Potassium
Potassium
Iron
Iron
Copper
Copper
Zinc
Zinc
Phosphorus
Phosphorus
Sodium
Sodium
Manganese
Manganese
Selenium
Selenium
19%
19%
17%
115%
40%
69%
57%
43%
47%
111%
Vitamin Comparison
Vitamin comparison score is based on the number of vitamins by which one or the other food is richer. The "coverage" charts below show how much of the daily needs can be covered by 300 grams of the food.
5
100 g
300 g
1 cubic inch - 17g 1 oz - 28.35g 1 package (4.5 oz) - 128g 1 cup, sliced - 144g 1 cup, melted - 240g
Vitamin C
Vit. C
Vitamin D
Vit. D
Vitamin A
Vit. A
Vitamin E
Vit. E
Vitamin B1
Vit. B1
Vitamin B2
Vit. B2
Vitamin B3
Vit. B3
Vitamin B5
Vit. B5
Vitamin B6
Vit. B6
Vitamin B12
Vit. B12
Vitamin K
Vit. K
Folate
Folate
0%
7.5%
58%
4.8%
18%
120%
7.1%
41%
54%
206%
5.8%
49%
5
100 g
300 g
1 sandwich - 78g
Vitamin C
Vit. C
Vitamin D
Vit. D
Vitamin A
Vit. A
Vitamin E
Vit. E
Vitamin B1
Vit. B1
Vitamin B2
Vit. B2
Vitamin B3
Vit. B3
Vitamin B5
Vit. B5
Vitamin B6
Vit. B6
Vitamin B12
Vit. B12
Vitamin K
Vit. K
Folate
Folate
0%
1.5%
3%
7.6%
79%
84%
105%
32%
49%
111%
12%
60%
All nutrients comparison - raw data values
Nutrient
DV% diff.
Saturated fat
17.41g
4.493g
59%
Vitamin B3
0.38mg
5.617mg
33%
Iron
0.5mg
3.06mg
32%
Vitamin B12
1.65µg
0.89µg
32%
Fats
27.68g
12.01g
24%
Cholesterol
100mg
33mg
22%
Vitamin B1
0.07mg
0.317mg
21%
Vitamin A
174µg
9µg
18%
Manganese
0.034mg
0.357mg
14%
Sodium
629mg
331mg
13%
Calcium
184mg
62mg
12%
Vitamin B2
0.52mg
0.363mg
12%
Copper
0.019mg
0.121mg
11%
Selenium
14.5µg
20.3µg
11%
Carbs
0.45g
31.5g
10%
Starch
22.87g
9%
Protein
20.75g
16.52g
8%
Phosphorus
188mg
134mg
8%
Monounsaturated fat
8.013g
4.835g
8%
Fiber
0g
1.7g
7%
Polyunsaturated fat
0.826g
1.68g
6%
Folate
65µg
80µg
4%
Vitamin B5
0.69mg
0.53mg
3%
Choline
15.4mg
34.4mg
3%
Fructose
2.27g
3%
Calories
334kcal
297kcal
2%
Vitamin D*
20 IU
2 IU
2%
Vitamin D
0.5µg
0.1µg
2%
Magnesium
20mg
27mg
2%
Vitamin B6
0.235mg
0.212mg
2%
Vitamin K
2.3µg
4.9µg
2%
Potassium
152mg
197mg
1%
Zinc
2.38mg
2.52mg
1%
Vitamin E
0.24mg
0.38mg
1%
Protein per 100 calories
6.2g
5.6g
N/A
Calories per 10 g protein
161kcal
180kcal
N/A
Weight per 100 calories
30g
34g
N/A
Unsaturated / Saturated Fat ratio
0.51
1.5
N/A
Net carbs
0.45g
29.8g
N/A
Sugar
0.45g
4.88g
N/A
Trans fat
0.514g
N/A
Tryptophan
0.322mg
0.144mg
0%
Threonine
0.751mg
0.46mg
0%
Isoleucine
1.015mg
0.642mg
0%
Leucine
1.929mg
1.13mg
0%
Lysine
1.851mg
0.785mg
0%
Methionine
0.592mg
0.306mg
0%
Phenylalanine
1.158mg
0.67mg
0%
Valine
1.34mg
0.728mg
0%
Histidine
0.716mg
0.402mg
0%
Omega-3 - EPA
0g
0.005g
N/A
Omega-3 - DHA
0g
0.001g
N/A
Omega-3 - ALA
0.121g
N/A
Omega-3 - DPA
0g
0.009g
N/A
Omega-6 - Gamma-linoleic acid
0.004g
N/A
Omega-6 - Dihomo-gamma-linoleic acid
0.009g
N/A
Omega-6 - Eicosadienoic acid
0.003g
N/A
Omega-6 - Linoleic acid
1.391g
N/A
Macronutrient Comparison
Macronutrient breakdown side-by-side comparison
4
21%
28%
48%
3%
Protein:
20.75 g
Fats:
27.68 g
Carbs:
0.45 g
Water:
48.42 g
Other:
2.7 g
1
17%
12%
32%
38%
Protein:
16.52 g
Fats:
12.01 g
Carbs:
31.5 g
Water:
38.45 g
Other:
1.52 g
Contains
more
Protein Protein
+25.6%
Contains
more
Fats Fats
+130.5%
Contains
more
Water Water
+25.9%
Contains
more
Other Other
+77.6%
Contains
more
Carbs Carbs
+6900%
Fat Type Comparison
Fat type breakdown side-by-side comparison
1
66%
31%
3%
Saturated fat:
Sat. Fat
17.41 g
Monounsaturated fat:
Mono. Fat
8.013 g
Polyunsaturated fat:
Poly. Fat
0.826 g
2
41%
44%
15%
Saturated fat:
Sat. Fat
4.493 g
Monounsaturated fat:
Mono. Fat
4.835 g
Polyunsaturated fat:
Poly. Fat
1.68 g
Contains
more
Mono. Fat Monounsaturated fat
+65.7%
Contains
less
Sat. Fat Saturated fat
-74.2%
Contains
more
Poly. Fat Polyunsaturated fat
+103.4%