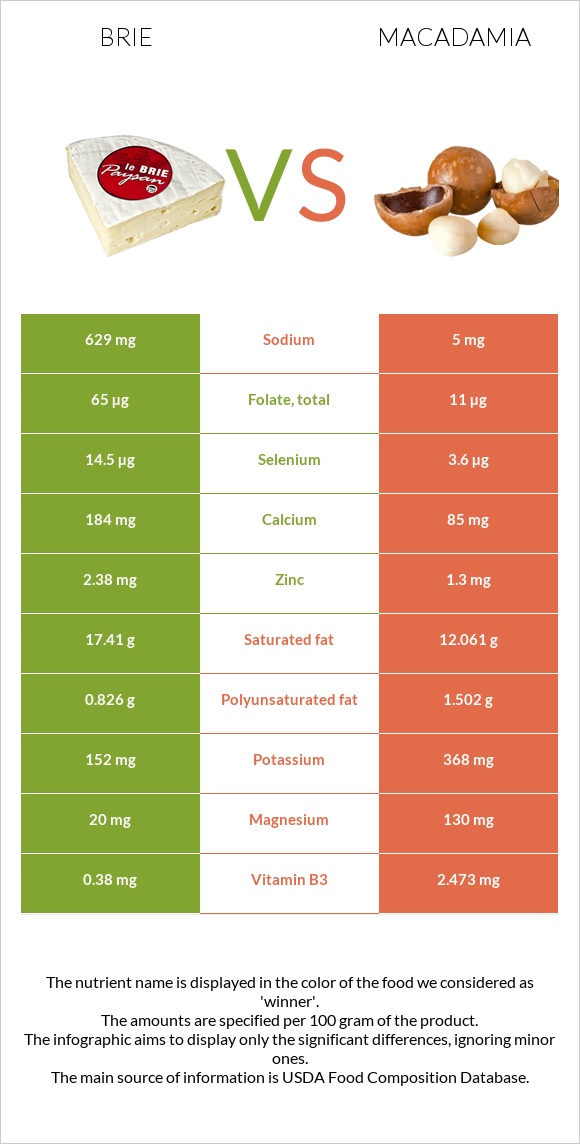
What are the differences between brie and macadamia? Brie is higher in vitamin B12 and vitamin B2, yet macadamia is higher in manganese, vitamin B1, copper, iron, and fiber. Macadamia's daily need coverage for manganese is 178% more. The amount of cholesterol in macadamia is lower. We used Cheese, brie and Nuts, macadamia nuts, raw types in this article.
Infographic
Mineral Comparison
Mineral comparison score is based on the number of minerals by which one or the other food is richer. The "coverage" charts below show how much of the daily needs can be covered by 300 grams of the food.
3
100 g
300 g
1 cubic inch - 17g 1 oz - 28.35g 1 package (4.5 oz) - 128g 1 cup, sliced - 144g 1 cup, melted - 240g
Magnesium
Magnesium
Calcium
Calcium
Potassium
Potassium
Iron
Iron
Copper
Copper
Zinc
Zinc
Phosphorus
Phosphorus
Sodium
Sodium
Manganese
Manganese
Selenium
Selenium
14%
55%
13%
19%
6.3%
65%
81%
82%
4.4%
79%
6
100 g
300 g
1 oz (10-12 kernels) - 28.35g 1 cup, whole or halves - 134g
Magnesium
Magnesium
Calcium
Calcium
Potassium
Potassium
Iron
Iron
Copper
Copper
Zinc
Zinc
Phosphorus
Phosphorus
Sodium
Sodium
Manganese
Manganese
Selenium
Selenium
93%
26%
32%
138%
252%
35%
81%
0.65%
539%
20%
Vitamin Comparison
Vitamin comparison score is based on the number of vitamins by which one or the other food is richer. The "coverage" charts below show how much of the daily needs can be covered by 300 grams of the food.
6
100 g
300 g
1 cubic inch - 17g 1 oz - 28.35g 1 package (4.5 oz) - 128g 1 cup, sliced - 144g 1 cup, melted - 240g
Vitamin C
Vit. C
Vitamin D
Vit. D
Vitamin A
Vit. A
Vitamin E
Vit. E
Vitamin B1
Vit. B1
Vitamin B2
Vit. B2
Vitamin B3
Vit. B3
Vitamin B5
Vit. B5
Vitamin B6
Vit. B6
Vitamin B12
Vit. B12
Vitamin K
Vit. K
Folate
Folate
0%
7.5%
58%
4.8%
18%
120%
7.1%
41%
54%
206%
5.8%
49%
5
100 g
300 g
1 oz (10-12 kernels) - 28.35g 1 cup, whole or halves - 134g
Vitamin C
Vit. C
Vitamin D
Vit. D
Vitamin A
Vit. A
Vitamin E
Vit. E
Vitamin B1
Vit. B1
Vitamin B2
Vit. B2
Vitamin B3
Vit. B3
Vitamin B5
Vit. B5
Vitamin B6
Vit. B6
Vitamin B12
Vit. B12
Vitamin K
Vit. K
Folate
Folate
4%
0%
0%
11%
299%
37%
46%
45%
63%
0%
0%
8.3%
All nutrients comparison - raw data values
Nutrient
DV% diff.
Manganese
0.034mg
4.131mg
178%
Monounsaturated fat
8.013g
58.877g
127%
Vitamin B1
0.07mg
1.195mg
94%
Copper
0.019mg
0.756mg
82%
Fats
27.68g
75.77g
74%
Vitamin B12
1.65µg
0µg
69%
Iron
0.5mg
3.69mg
40%
Fiber
0g
8.6g
34%
Cholesterol
100mg
0mg
33%
Vitamin B2
0.52mg
0.162mg
28%
Sodium
629mg
5mg
27%
Protein
20.75g
7.91g
26%
Magnesium
20mg
130mg
26%
Saturated fat
17.41g
12.061g
24%
Selenium
14.5µg
3.6µg
20%
Calories
334kcal
718kcal
19%
Vitamin A
174µg
0µg
19%
Folate
65µg
11µg
14%
Vitamin B3
0.38mg
2.473mg
13%
Calcium
184mg
85mg
10%
Zinc
2.38mg
1.3mg
10%
Potassium
152mg
368mg
6%
Polyunsaturated fat
0.826g
1.502g
5%
Carbs
0.45g
13.82g
4%
Vitamin D*
20 IU
0 IU
3%
Vitamin D
0.5µg
0µg
3%
Vitamin B6
0.235mg
0.275mg
3%
Choline
15.4mg
3%
Vitamin E
0.24mg
0.54mg
2%
Vitamin K
2.3µg
2%
Vitamin C
0mg
1.2mg
1%
Vitamin B5
0.69mg
0.758mg
1%
Protein per 100 calories
6.2g
1.1g
N/A
Calories per 10 g protein
161kcal
908kcal
N/A
Weight per 100 calories
30g
14g
N/A
Unsaturated / Saturated Fat ratio
0.51
5
N/A
Net carbs
0.45g
5.22g
N/A
Sugar
0.45g
4.57g
N/A
Starch
1.05g
0%
Phosphorus
188mg
188mg
0%
Tryptophan
0.322mg
0.067mg
0%
Threonine
0.751mg
0.37mg
0%
Isoleucine
1.015mg
0.314mg
0%
Leucine
1.929mg
0.602mg
0%
Lysine
1.851mg
0.018mg
0%
Methionine
0.592mg
0.023mg
0%
Phenylalanine
1.158mg
0.665mg
0%
Valine
1.34mg
0.363mg
0%
Histidine
0.716mg
0.195mg
0%
Fructose
0.07g
0%
Macronutrient Comparison
Macronutrient breakdown side-by-side comparison
3
21%
28%
48%
3%
Protein:
20.75 g
Fats:
27.68 g
Carbs:
0.45 g
Water:
48.42 g
Other:
2.7 g
2
8%
76%
14%
Protein:
7.91 g
Fats:
75.77 g
Carbs:
13.82 g
Water:
1.36 g
Other:
1.14 g
Contains
more
Protein Protein
+162.3%
Contains
more
Water Water
+3460.3%
Contains
more
Other Other
+136.8%
Contains
more
Fats Fats
+173.7%
Contains
more
Carbs Carbs
+2971.1%
Fat Type Comparison
Fat type breakdown side-by-side comparison
0
66%
31%
3%
Saturated fat:
Sat. Fat
17.41 g
Monounsaturated fat:
Mono. Fat
8.013 g
Polyunsaturated fat:
Poly. Fat
0.826 g
3
17%
81%
2%
Saturated fat:
Sat. Fat
12.061 g
Monounsaturated fat:
Mono. Fat
58.877 g
Polyunsaturated fat:
Poly. Fat
1.502 g
Contains
less
Sat. Fat Saturated fat
-30.7%
Contains
more
Mono. Fat Monounsaturated fat
+634.8%
Contains
more
Poly. Fat Polyunsaturated fat
+81.8%