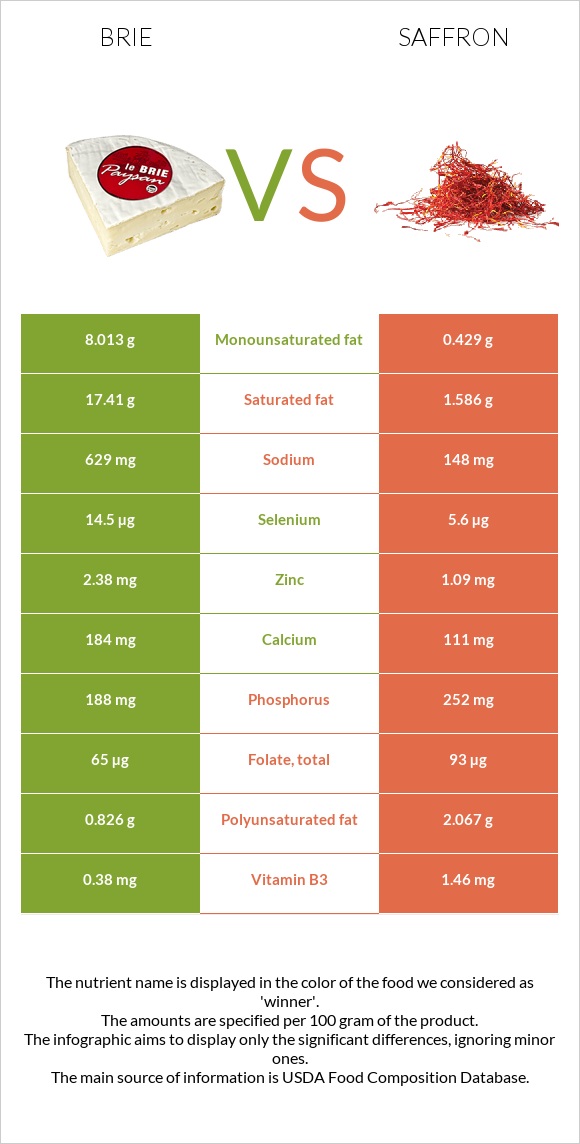
Summary of differences between brie and saffron Brie has more vitamin B12; however, saffron is higher in manganese, iron, vitamin C, vitamin B6, magnesium, potassium, and copper. Saffron covers your daily need for manganese, 1234% more than brie. Saffron has less cholesterol. The glycemic index of saffron is higher. These are the specific foods used in this comparison Cheese, brie and Spices, saffron .
Infographic
Mineral Comparison
Mineral comparison score is based on the number of minerals by which one or the other food is richer. The "coverage" charts below show how much of the daily needs can be covered by 300 grams of the food.
3
100 g
300 g
1 cubic inch - 17g 1 oz - 28.35g 1 package (4.5 oz) - 128g 1 cup, sliced - 144g 1 cup, melted - 240g
Magnesium
Magnesium
Calcium
Calcium
Potassium
Potassium
Iron
Iron
Copper
Copper
Zinc
Zinc
Phosphorus
Phosphorus
Sodium
Sodium
Manganese
Manganese
Selenium
Selenium
14%
55%
13%
19%
6.3%
65%
81%
82%
4.4%
79%
7
100 g
300 g
0.25 tsp - 0.5g 1 tbsp - 2.1g
Magnesium
Magnesium
Calcium
Calcium
Potassium
Potassium
Iron
Iron
Copper
Copper
Zinc
Zinc
Phosphorus
Phosphorus
Sodium
Sodium
Manganese
Manganese
Selenium
Selenium
189%
33%
152%
416%
109%
30%
108%
19%
3705%
31%
Vitamin Comparison
Vitamin comparison score is based on the number of vitamins by which one or the other food is richer. The "coverage" charts below show how much of the daily needs can be covered by 300 grams of the food.
7
100 g
300 g
1 cubic inch - 17g 1 oz - 28.35g 1 package (4.5 oz) - 128g 1 cup, sliced - 144g 1 cup, melted - 240g
Vitamin C
Vit. C
Vitamin D
Vit. D
Vitamin A
Vit. A
Vitamin E
Vit. E
Vitamin B1
Vit. B1
Vitamin B2
Vit. B2
Vitamin B3
Vit. B3
Vitamin B5
Vit. B5
Vitamin B6
Vit. B6
Vitamin B12
Vit. B12
Vitamin K
Vit. K
Folate
Folate
0%
7.5%
58%
4.8%
18%
120%
7.1%
41%
54%
206%
5.8%
49%
5
100 g
300 g
0.25 tsp - 0.5g 1 tbsp - 2.1g
Vitamin C
Vit. C
Vitamin D
Vit. D
Vitamin A
Vit. A
Vitamin E
Vit. E
Vitamin B1
Vit. B1
Vitamin B2
Vit. B2
Vitamin B3
Vit. B3
Vitamin B5
Vit. B5
Vitamin B6
Vit. B6
Vitamin B12
Vit. B12
Vitamin K
Vit. K
Folate
Folate
269%
0%
9%
0%
29%
62%
27%
0%
233%
0%
0%
70%
All nutrients comparison - raw data values
Nutrient
DV% diff.
Manganese
0.034mg
28.408mg
1234%
Iron
0.5mg
11.1mg
133%
Vitamin C
0mg
80.8mg
90%
Saturated fat
17.41g
1.586g
72%
Vitamin B12
1.65µg
0µg
69%
Vitamin B6
0.235mg
1.01mg
60%
Magnesium
20mg
264mg
58%
Potassium
152mg
1724mg
46%
Fats
27.68g
5.85g
34%
Copper
0.019mg
0.328mg
34%
Cholesterol
100mg
0mg
33%
Carbs
0.45g
65.37g
22%
Sodium
629mg
148mg
21%
Protein
20.75g
11.43g
19%
Vitamin B2
0.52mg
0.267mg
19%
Monounsaturated fat
8.013g
0.429g
19%
Fiber
0g
3.9g
16%
Vitamin A
174µg
27µg
16%
Selenium
14.5µg
5.6µg
16%
Vitamin B5
0.69mg
14%
Zinc
2.38mg
1.09mg
12%
Phosphorus
188mg
252mg
9%
Polyunsaturated fat
0.826g
2.067g
8%
Calcium
184mg
111mg
7%
Vitamin B3
0.38mg
1.46mg
7%
Folate
65µg
93µg
7%
Vitamin B1
0.07mg
0.115mg
4%
Vitamin D*
20 IU
0 IU
3%
Vitamin D
0.5µg
0µg
3%
Choline
15.4mg
3%
Vitamin E
0.24mg
2%
Vitamin K
2.3µg
2%
Calories
334kcal
310kcal
1%
Protein per 100 calories
6.2g
3.7g
N/A
Calories per 10 g protein
161kcal
271kcal
N/A
Weight per 100 calories
30g
32g
N/A
Unsaturated / Saturated Fat ratio
0.51
1.6
N/A
Net carbs
0.45g
61.47g
N/A
Sugar
0.45g
N/A
Tryptophan
0.322mg
0%
Threonine
0.751mg
0%
Isoleucine
1.015mg
0%
Leucine
1.929mg
0%
Lysine
1.851mg
0%
Methionine
0.592mg
0%
Phenylalanine
1.158mg
0%
Valine
1.34mg
0%
Histidine
0.716mg
0%
Omega-3 - DPA
0g
0.006g
N/A
Macronutrient Comparison
Macronutrient breakdown side-by-side comparison
3
21%
28%
48%
3%
Protein:
20.75 g
Fats:
27.68 g
Carbs:
0.45 g
Water:
48.42 g
Other:
2.7 g
2
11%
6%
65%
12%
5%
Protein:
11.43 g
Fats:
5.85 g
Carbs:
65.37 g
Water:
11.9 g
Other:
5.45 g
Contains
more
Protein Protein
+81.5%
Contains
more
Fats Fats
+373.2%
Contains
more
Water Water
+306.9%
Contains
more
Carbs Carbs
+14426.7%
Contains
more
Other Other
+101.9%
Fat Type Comparison
Fat type breakdown side-by-side comparison
1
66%
31%
3%
Saturated fat:
Sat. Fat
17.41 g
Monounsaturated fat:
Mono. Fat
8.013 g
Polyunsaturated fat:
Poly. Fat
0.826 g
2
39%
11%
51%
Saturated fat:
Sat. Fat
1.586 g
Monounsaturated fat:
Mono. Fat
0.429 g
Polyunsaturated fat:
Poly. Fat
2.067 g
Contains
more
Mono. Fat Monounsaturated fat
+1767.8%
Contains
less
Sat. Fat Saturated fat
-90.9%
Contains
more
Poly. Fat Polyunsaturated fat
+150.2%