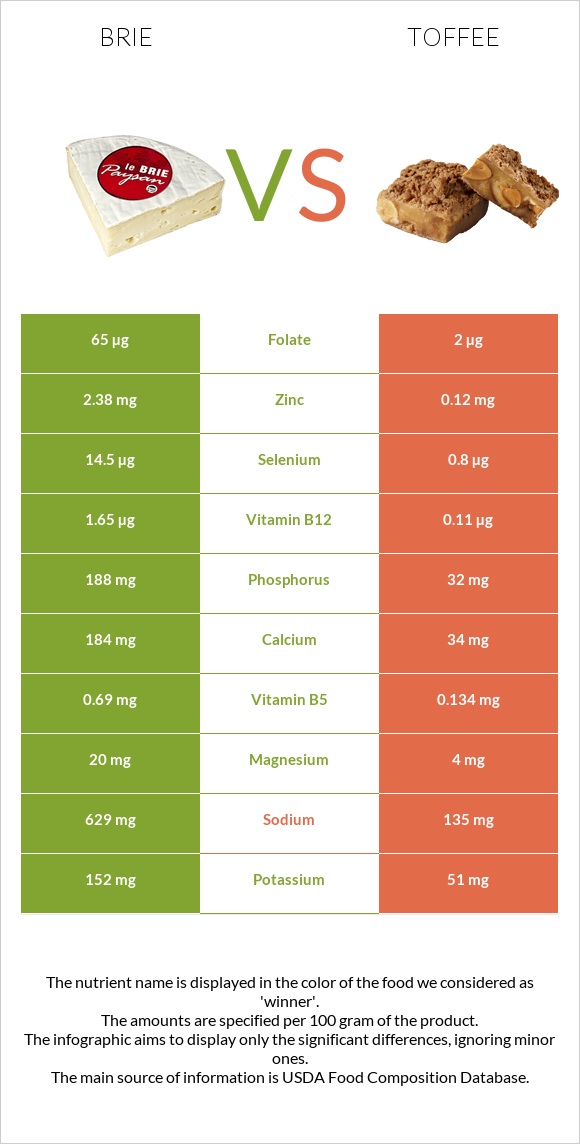
How are brie and toffee different? Brie has more vitamin B12, vitamin B2, selenium, phosphorus, zinc, vitamin B6, folate, and calcium than toffee. Daily need coverage for vitamin B12 for brie is 64% higher. Brie contains 33 times more folate than toffee. While brie contains 65µg of folate, toffee contains only 2µg. Toffee has less sodium. Brie has a lower glycemic index (0) than toffee (51). Cheese, brie and Candies, toffee, prepared-from-recipe are the varieties used in this article.
Infographic
Mineral Comparison
Mineral comparison score is based on the number of minerals by which one or the other food is richer. The "coverage" charts below show how much of the daily needs can be covered by 300 grams of the food.
9
100 g
300 g
1 cubic inch - 17g 1 oz - 28.35g 1 package (4.5 oz) - 128g 1 cup, sliced - 144g 1 cup, melted - 240g
Magnesium
Magnesium
Calcium
Calcium
Potassium
Potassium
Iron
Iron
Copper
Copper
Zinc
Zinc
Phosphorus
Phosphorus
Sodium
Sodium
Manganese
Manganese
Selenium
Selenium
14%
55%
13%
19%
6.3%
65%
81%
82%
4.4%
79%
1
100 g
300 g
1 piece - 12g
Magnesium
Magnesium
Calcium
Calcium
Potassium
Potassium
Iron
Iron
Copper
Copper
Zinc
Zinc
Phosphorus
Phosphorus
Sodium
Sodium
Manganese
Manganese
Selenium
Selenium
2.9%
10%
4.5%
1.1%
1%
3.3%
14%
18%
0.26%
4.4%
Vitamin Comparison
Vitamin comparison score is based on the number of vitamins by which one or the other food is richer. The "coverage" charts below show how much of the daily needs can be covered by 300 grams of the food.
8
100 g
300 g
1 cubic inch - 17g 1 oz - 28.35g 1 package (4.5 oz) - 128g 1 cup, sliced - 144g 1 cup, melted - 240g
Vitamin C
Vit. C
Vitamin D
Vit. D
Vitamin A
Vit. A
Vitamin E
Vit. E
Vitamin B1
Vit. B1
Vitamin B2
Vit. B2
Vitamin B3
Vit. B3
Vitamin B5
Vit. B5
Vitamin B6
Vit. B6
Vitamin B12
Vit. B12
Vitamin K
Vit. K
Folate
Folate
0%
7.5%
58%
4.8%
18%
120%
7.1%
41%
54%
206%
5.8%
49%
4
100 g
300 g
1 piece - 12g
Vitamin C
Vit. C
Vitamin D
Vit. D
Vitamin A
Vit. A
Vitamin E
Vit. E
Vitamin B1
Vit. B1
Vitamin B2
Vit. B2
Vitamin B3
Vit. B3
Vitamin B5
Vit. B5
Vitamin B6
Vit. B6
Vitamin B12
Vit. B12
Vitamin K
Vit. K
Folate
Folate
0.67%
0%
106%
19%
2%
16%
0.54%
8%
2.1%
14%
7%
1.5%
All nutrients comparison - raw data values
Nutrient
DV% diff.
Vitamin B12
1.65µg
0.11µg
64%
Protein
20.75g
1.07g
39%
Vitamin B2
0.52mg
0.068mg
35%
Selenium
14.5µg
0.8µg
25%
Phosphorus
188mg
32mg
22%
Carbs
0.45g
64.72g
21%
Zinc
2.38mg
0.12mg
21%
Sodium
629mg
135mg
21%
Vitamin B6
0.235mg
0.009mg
17%
Vitamin A
174µg
319µg
16%
Folate
65µg
2µg
16%
Calcium
184mg
34mg
15%
Saturated fat
17.41g
20.565g
14%
Calories
334kcal
560kcal
11%
Vitamin B5
0.69mg
0.134mg
11%
Fats
27.68g
32.75g
8%
Iron
0.5mg
0.03mg
6%
Vitamin E
0.24mg
0.94mg
5%
Vitamin B1
0.07mg
0.008mg
5%
Magnesium
20mg
4mg
4%
Vitamin D*
20 IU
3%
Vitamin D
0.5µg
3%
Potassium
152mg
51mg
3%
Choline
15.4mg
3%
Polyunsaturated fat
0.826g
1.222g
3%
Copper
0.019mg
0.003mg
2%
Vitamin B3
0.38mg
0.029mg
2%
Monounsaturated fat
8.013g
8.964g
2%
Cholesterol
100mg
104mg
1%
Manganese
0.034mg
0.002mg
1%
Protein per 100 calories
6.2g
0.19g
N/A
Calories per 10 g protein
161kcal
5234kcal
N/A
Weight per 100 calories
30g
18g
N/A
Unsaturated / Saturated Fat ratio
0.51
0.5
N/A
Vitamin C
0mg
0.2mg
0%
Net carbs
0.45g
64.72g
N/A
Sugar
0.45g
63.47g
N/A
Vitamin K
2.3µg
2.8µg
0%
Trans fat
0.674g
N/A
Tryptophan
0.322mg
0%
Threonine
0.751mg
0%
Isoleucine
1.015mg
0%
Leucine
1.929mg
0%
Lysine
1.851mg
0%
Methionine
0.592mg
0%
Phenylalanine
1.158mg
0%
Valine
1.34mg
0%
Histidine
0.716mg
0%
Omega-3 - ALA
0.065g
N/A
Omega-6 - Linoleic acid
0.445g
N/A
Macronutrient Comparison
Macronutrient breakdown side-by-side comparison
3
21%
28%
48%
3%
Protein:
20.75 g
Fats:
27.68 g
Carbs:
0.45 g
Water:
48.42 g
Other:
2.7 g
2
33%
65%
Protein:
1.07 g
Fats:
32.75 g
Carbs:
64.72 g
Water:
0.55 g
Other:
0.91 g
Contains
more
Protein Protein
+1839.3%
Contains
more
Water Water
+8703.6%
Contains
more
Other Other
+196.7%
Contains
more
Fats Fats
+18.3%
Contains
more
Carbs Carbs
+14282.2%
Fat Type Comparison
Fat type breakdown side-by-side comparison
1
66%
31%
3%
Saturated fat:
Sat. Fat
17.41 g
Monounsaturated fat:
Mono. Fat
8.013 g
Polyunsaturated fat:
Poly. Fat
0.826 g
2
67%
29%
4%
Saturated fat:
Sat. Fat
20.565 g
Monounsaturated fat:
Mono. Fat
8.964 g
Polyunsaturated fat:
Poly. Fat
1.222 g
Contains
less
Sat. Fat Saturated fat
-15.3%
Contains
more
Mono. Fat Monounsaturated fat
+11.9%
Contains
more
Poly. Fat Polyunsaturated fat
+47.9%