Toffee nutrition: calories, carbs, GI, protein, fiber, fats
Carbs in Toffee
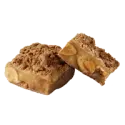
Toffee is made with caramelized sugar and butter, more often flour is also added.
It primarily consists of carbs. In 100g of Toffee, there are 65g of carbs. You can compare the carb distribution to the other macronutrients in the chart below.
Macronutrients chart
Toffee provides 22% of the daily carbohydrate requirements.
It is higher in carbs than 14% of all foods in the foodstruct database.
Carbs per serving size
The serving size for Toffee is one piece, equalling 12 grams.
One serving of Toffee contains 7.8g of carbs.
Net carbs in Toffee
This food does not contain any fiber. Thus, all the carbs in Toffee are net carbs, equalling 65 grams.
Fiber content ratio for Toffee
COMPARISON
| Food | Carbs per serving | Carbs per 100g |
| Toffee | 7.8g (12g) | 65g |
| Fudge | 13g (17g) | 77g |
| White chocolate | 50g (85g) | 59g |
| Caramel | 7.8g (10g) | 77g |

Top nutrition facts for Toffee
| Calories ⓘ Calories for selected serving | 560 kcal |
| Glycemic index ⓘ Gi values are taken from various scientific sources. GI values less than 55 are considered as low. Values above 70 are considered as high. | 51 (low) |
| Glycemic load ⓘ Glycemic Load (GL) is a metric that measures both the quality (Glycemic Index) and quantity of carbohydrates in a specific serving of food to estimate its impact on blood sugar levels. It is calculated as: (GI × Carbs in grams) / 100. | 4 (low) |
| Net carbs ⓘ Net Carbs = Total Carbohydrates – Fiber – Sugar Alcohols | 65 g |
| Default serving size ⓘ Serving sizes are mostly taken from FDA's Reference Amounts Customarily Consumed (RACCs) | 1 piece (12 g) |
| Acidity (Based on PRAL) ⓘ PRAL (Potential renal acid load) is calculated using a formula. On the PRAL scale the higher the positive value, the more is the acidifying effect on the body. The lower the negative value, the higher the alkalinity of the food. 0 is neutral. | 0.1 (neutral) |
Toffee calories (kcal)
| Calories for different serving sizes of toffee | Calories | Weight |
|---|---|---|
| Calories in 100 grams | 560 | |
| Calories in 1 piece | 67 | 12 g |
Extra Nutrition facts for Toffee
| Weight per 100 calories ⓘ Shows how many grams of this food equal 100 kcal—higher grams mean a larger portion for the same calories. | 18 g |
| Unsaturated / Saturated Fat ratio ⓘ (monounsaturated + polyunsaturated) / saturated, ≥2 broadly recommended by major guidelines for heart health | 0.5 |
Toffee Glycemic index (GI)
Toffee Glycemic load (GL)
Mineral coverage chart
Mineral chart - relative view
Vitamin coverage chart
Vitamin chart - relative view
Fat type information
All nutrients for Toffee per 100g
| Nutrient | Value | DV% | In TOP % of foods | Comparison |
| Vitamin A | 319µg | 35% | 6% | |
| Calories | 560kcal | 28% | 4% |
11.9 times more than Orange
|
| Weight per 100 calories | 18g | N/A | 97% | |
| Protein | 1.1g | 3% | 85% |
2.6 times less than Broccoli
|
| Unsaturated / Saturated Fat ratio | 0.5 | N/A | 86% | |
| Fats | 33g | 50% | 6% |
Equal to Cheese
|
| Vitamin C | 0.2mg | 0% | 43% |
265 times less than Lemon
|
| Net carbs | 65g | N/A | 11% |
1.2 times more than Chocolate
|
| Carbs | 65g | 22% | 14% |
2.3 times more than Rice
|
| Cholesterol | 104mg | 35% | 6% |
3.6 times less than Egg
|
| Magnesium | 4mg | 1% | 85% |
35 times less than Almonds
|
| Calcium | 34mg | 3% | 38% |
3.7 times less than Milk
|
| Potassium | 51mg | 2% | 87% |
2.9 times less than Cucumber
|
| Iron | 0.03mg | 0% | 95% |
86.7 times less than Beef broiled
|
| Sugar | 63g | N/A | 2% |
7.1 times more than Coca-Cola
|
| Fiber | 0g | 0% | 100% |
N/A
|
| Copper | 0mg | 0% | 83% |
47.3 times less than Shiitake
|
| Zinc | 0.12mg | 1% | 81% |
52.6 times less than Beef broiled
|
| Phosphorus | 32mg | 5% | 77% |
5.7 times less than Chicken meat
|
| Sodium | 135mg | 6% | 45% |
3.6 times less than White bread
|
| Vitamin E | 0.94mg | 6% | 15% |
1.6 times less than Kiwi
|
| Selenium | 0.8µg | 1% | 65% | |
| Manganese | 0mg | 0% | 74% | |
| Vitamin B1 | 0.01mg | 1% | 87% |
33.3 times less than Pea raw
|
| Vitamin B2 | 0.07mg | 5% | 69% |
1.9 times less than Avocado
|
| Vitamin B3 | 0.03mg | 0% | 88% |
330.1 times less than Turkey meat
|
| Vitamin B5 | 0.13mg | 3% | 61% |
8.4 times less than Sunflower seeds
|
| Vitamin B6 | 0.01mg | 1% | 85% |
13.2 times less than Oats
|
| Vitamin B12 | 0.11µg | 5% | 49% |
6.4 times less than Pork
|
| Vitamin K | 2.8µg | 2% | 21% |
36.3 times less than Broccoli
|
| Folate | 2µg | 1% | 76% |
30.5 times less than Brussels sprouts
|
| Trans fat | 0.67g | N/A | 5% |
22.1 times less than Margarine
|
| Saturated fat | 21g | 103% | 2% |
3.5 times more than Beef broiled
|
| Monounsaturated fat | 9g | N/A | 11% |
1.1 times less than Avocado
|
| Polyunsaturated fat | 1.2g | N/A | 34% |
38.6 times less than Walnut
|
| Caffeine | 0mg | 0% | 100% | |
| Omega-3 - EPA | 0g | N/A | 100% |
N/A
|
| Omega-3 - DHA | 0g | N/A | 100% |
N/A
|
| Omega-3 - ALA | 0.07g | N/A | 11% |
140.6 times less than Canola oil
|
| Omega-3 - DPA | 0g | N/A | 100% |
N/A
|
| Omega-6 - Linoleic acid | 0.45g | N/A | 12% |
27.7 times less than Almonds
|
Check out similar food or compare with current
NUTRITION FACTS LABEL
Serving Size ______________
Health checks
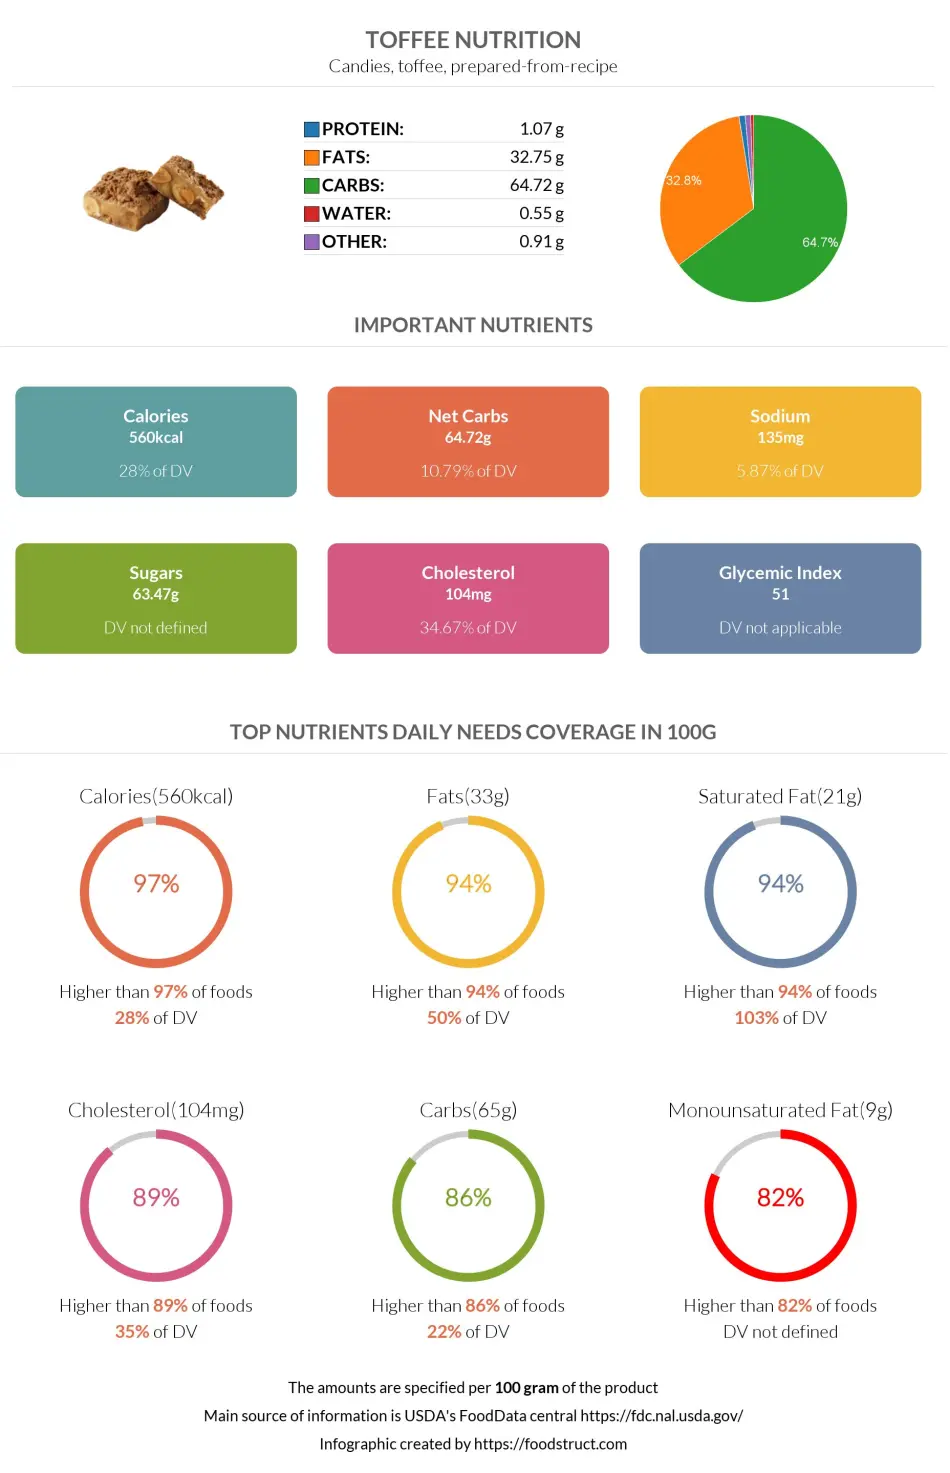
Toffee nutrition infographic
References
All the values for which the sources are not specified explicitly are taken from FDA’s Food Central. The exact link to the food presented on this page can be found below.