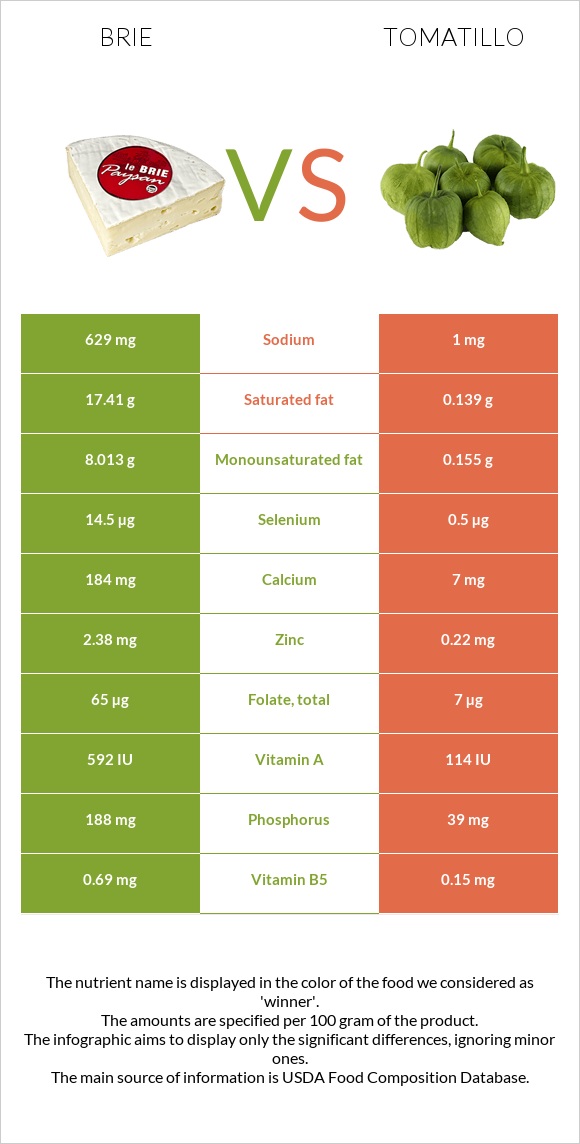
Significant differences between brie and tomatillos Brie has more vitamin B12, vitamin B2, selenium, phosphorus, zinc, and calcium; however, tomatillos are richer in manganese. Tomatillos cover your daily manganese needs 6651% more than brie. Tomatillos contain less cholesterol. Specific food types used in this comparison are Cheese, brie and Tomatillos, raw .
Infographic
Mineral Comparison
Mineral comparison score is based on the number of minerals by which one or the other food is richer. The "coverage" charts below show how much of the daily needs can be covered by 300 grams of the food.
4
100 g
300 g
1 cubic inch - 17g 1 oz - 28.35g 1 package (4.5 oz) - 128g 1 cup, sliced - 144g 1 cup, melted - 240g
Magnesium
Magnesium
Calcium
Calcium
Potassium
Potassium
Iron
Iron
Copper
Copper
Zinc
Zinc
Phosphorus
Phosphorus
Sodium
Sodium
Manganese
Manganese
Selenium
Selenium
14%
55%
13%
19%
6.3%
65%
81%
82%
4.4%
79%
5
100 g
300 g
1 medium - 34g 0.5 cup, chopped or diced - 66g
Magnesium
Magnesium
Calcium
Calcium
Potassium
Potassium
Iron
Iron
Copper
Copper
Zinc
Zinc
Phosphorus
Phosphorus
Sodium
Sodium
Manganese
Manganese
Selenium
Selenium
14%
2.1%
24%
23%
26%
6%
17%
0.13%
19957%
2.7%
Vitamin Comparison
Vitamin comparison score is based on the number of vitamins by which one or the other food is richer. The "coverage" charts below show how much of the daily needs can be covered by 300 grams of the food.
8
100 g
300 g
1 cubic inch - 17g 1 oz - 28.35g 1 package (4.5 oz) - 128g 1 cup, sliced - 144g 1 cup, melted - 240g
Vitamin C
Vit. C
Vitamin D
Vit. D
Vitamin A
Vit. A
Vitamin E
Vit. E
Vitamin B1
Vit. B1
Vitamin B2
Vit. B2
Vitamin B3
Vit. B3
Vitamin B5
Vit. B5
Vitamin B6
Vit. B6
Vitamin B12
Vit. B12
Vitamin K
Vit. K
Folate
Folate
0%
7.5%
58%
4.8%
18%
120%
7.1%
41%
54%
206%
5.8%
49%
4
100 g
300 g
1 medium - 34g 0.5 cup, chopped or diced - 66g
Vitamin C
Vit. C
Vitamin D
Vit. D
Vitamin A
Vit. A
Vitamin E
Vit. E
Vitamin B1
Vit. B1
Vitamin B2
Vit. B2
Vitamin B3
Vit. B3
Vitamin B5
Vit. B5
Vitamin B6
Vit. B6
Vitamin B12
Vit. B12
Vitamin K
Vit. K
Folate
Folate
39%
0%
2%
7.6%
11%
8.1%
35%
9%
13%
0%
25%
5.3%
All nutrients comparison - raw data values
Nutrient
DV% diff.
Manganese
0.034mg
153mg
6651%
Saturated fat
17.41g
0.139g
79%
Vitamin B12
1.65µg
0µg
69%
Fats
27.68g
1.02g
41%
Protein
20.75g
0.96g
40%
Vitamin B2
0.52mg
0.035mg
37%
Cholesterol
100mg
0mg
33%
Sodium
629mg
1mg
27%
Selenium
14.5µg
0.5µg
25%
Phosphorus
188mg
39mg
21%
Zinc
2.38mg
0.22mg
20%
Monounsaturated fat
8.013g
0.155g
20%
Vitamin A
174µg
6µg
19%
Calcium
184mg
7mg
18%
Calories
334kcal
32kcal
15%
Folate
65µg
7µg
15%
Vitamin B6
0.235mg
0.056mg
14%
Vitamin C
0mg
11.7mg
13%
Vitamin B5
0.69mg
0.15mg
11%
Vitamin B3
0.38mg
1.85mg
9%
Fiber
0g
1.9g
8%
Copper
0.019mg
0.079mg
7%
Vitamin K
2.3µg
10.1µg
7%
Vitamin D*
20 IU
0 IU
3%
Vitamin D
0.5µg
0µg
3%
Potassium
152mg
268mg
3%
Polyunsaturated fat
0.826g
0.417g
3%
Carbs
0.45g
5.84g
2%
Iron
0.5mg
0.62mg
2%
Vitamin B1
0.07mg
0.044mg
2%
Vitamin E
0.24mg
0.38mg
1%
Choline
15.4mg
7.6mg
1%
Protein per 100 calories
6.2g
3g
N/A
Calories per 10 g protein
161kcal
333kcal
N/A
Weight per 100 calories
30g
313g
N/A
Unsaturated / Saturated Fat ratio
0.51
4.1
N/A
Net carbs
0.45g
3.94g
N/A
Magnesium
20mg
20mg
0%
Sugar
0.45g
3.93g
N/A
Tryptophan
0.322mg
0%
Threonine
0.751mg
0%
Isoleucine
1.015mg
0%
Leucine
1.929mg
0%
Lysine
1.851mg
0%
Methionine
0.592mg
0%
Phenylalanine
1.158mg
0%
Valine
1.34mg
0%
Histidine
0.716mg
0%
Macronutrient Comparison
Macronutrient breakdown side-by-side comparison
3
21%
28%
48%
3%
Protein:
20.75 g
Fats:
27.68 g
Carbs:
0.45 g
Water:
48.42 g
Other:
2.7 g
2
6%
92%
Protein:
0.96 g
Fats:
1.02 g
Carbs:
5.84 g
Water:
91.63 g
Other:
0.55 g
Contains
more
Protein Protein
+2061.5%
Contains
more
Fats Fats
+2613.7%
Contains
more
Other Other
+390.9%
Contains
more
Carbs Carbs
+1197.8%
Contains
more
Water Water
+89.2%
Fat Type Comparison
Fat type breakdown side-by-side comparison
2
66%
31%
3%
Saturated fat:
Sat. Fat
17.41 g
Monounsaturated fat:
Mono. Fat
8.013 g
Polyunsaturated fat:
Poly. Fat
0.826 g
1
20%
22%
59%
Saturated fat:
Sat. Fat
0.139 g
Monounsaturated fat:
Mono. Fat
0.155 g
Polyunsaturated fat:
Poly. Fat
0.417 g
Contains
more
Mono. Fat Monounsaturated fat
+5069.7%
Contains
more
Poly. Fat Polyunsaturated fat
+98.1%
Contains
less
Sat. Fat Saturated fat
-99.2%