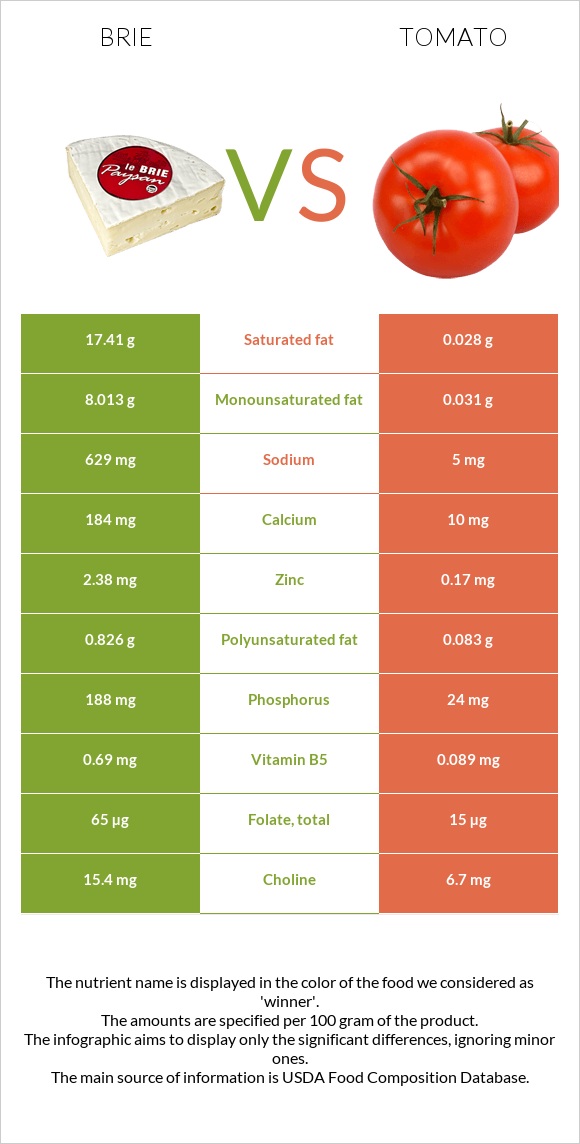
A recap on the differences between brie and tomatoes Brie is higher in vitamin B12, vitamin B2, selenium, phosphorus, zinc, and calcium, yet tomatoes are higher in vitamin C. Brie covers your daily saturated fat needs 87% more than tomatoes. The amount of cholesterol in tomatoes is lower. The glycemic index of brie is lower. Food varieties used in this article are Cheese, brie and Tomatoes, red, ripe, raw, year round average .
Infographic
Mineral Comparison
Mineral comparison score is based on the number of minerals by which one or the other food is richer. The "coverage" charts below show how much of the daily needs can be covered by 300 grams of the food.
6
100 g
300 g
1 cubic inch - 17g 1 oz - 28.35g 1 package (4.5 oz) - 128g 1 cup, sliced - 144g 1 cup, melted - 240g
Magnesium
Magnesium
Calcium
Calcium
Potassium
Potassium
Iron
Iron
Copper
Copper
Zinc
Zinc
Phosphorus
Phosphorus
Sodium
Sodium
Manganese
Manganese
Selenium
Selenium
14%
55%
13%
19%
6.3%
65%
81%
82%
4.4%
79%
4
100 g
300 g
1 slice, thin/small - 15g 1 cherry - 17g 1 slice, medium (1/4" thick) - 20g 1 slice, thick/large (1/2" thick) - 27g 1 wedge (1/4 of medium tomato) - 31g 1 Italian tomato - 62g 1 plum tomato - 62g 1 small whole (2-2/5" dia) - 91g 1 medium whole (2-3/5" dia) - 123g 1 NLEA serving - 148g 1 cup cherry tomatoes - 149g 1 cup, chopped or sliced - 180g 1 large whole (3" dia) - 182g
Magnesium
Magnesium
Calcium
Calcium
Potassium
Potassium
Iron
Iron
Copper
Copper
Zinc
Zinc
Phosphorus
Phosphorus
Sodium
Sodium
Manganese
Manganese
Selenium
Selenium
7.9%
3%
21%
10%
20%
4.6%
10%
0.65%
15%
0%
Vitamin Comparison
Vitamin comparison score is based on the number of vitamins by which one or the other food is richer. The "coverage" charts below show how much of the daily needs can be covered by 300 grams of the food.
8
100 g
300 g
1 cubic inch - 17g 1 oz - 28.35g 1 package (4.5 oz) - 128g 1 cup, sliced - 144g 1 cup, melted - 240g
Vitamin C
Vit. C
Vitamin D
Vit. D
Vitamin A
Vit. A
Vitamin E
Vit. E
Vitamin B1
Vit. B1
Vitamin B2
Vit. B2
Vitamin B3
Vit. B3
Vitamin B5
Vit. B5
Vitamin B6
Vit. B6
Vitamin B12
Vit. B12
Vitamin K
Vit. K
Folate
Folate
0%
7.5%
58%
4.8%
18%
120%
7.1%
41%
54%
206%
5.8%
49%
4
100 g
300 g
1 slice, thin/small - 15g 1 cherry - 17g 1 slice, medium (1/4" thick) - 20g 1 slice, thick/large (1/2" thick) - 27g 1 wedge (1/4 of medium tomato) - 31g 1 Italian tomato - 62g 1 plum tomato - 62g 1 small whole (2-2/5" dia) - 91g 1 medium whole (2-3/5" dia) - 123g 1 NLEA serving - 148g 1 cup cherry tomatoes - 149g 1 cup, chopped or sliced - 180g 1 large whole (3" dia) - 182g
Vitamin C
Vit. C
Vitamin D
Vit. D
Vitamin A
Vit. A
Vitamin E
Vit. E
Vitamin B1
Vit. B1
Vitamin B2
Vit. B2
Vitamin B3
Vit. B3
Vitamin B5
Vit. B5
Vitamin B6
Vit. B6
Vitamin B12
Vit. B12
Vitamin K
Vit. K
Folate
Folate
46%
0%
14%
11%
9.3%
4.4%
11%
5.3%
18%
0%
20%
11%
All nutrients comparison - raw data values
Nutrient
DV% diff.
Saturated fat
17.41g
0.028g
79%
Vitamin B12
1.65µg
0µg
69%
Fats
27.68g
0.2g
42%
Protein
20.75g
0.88g
40%
Vitamin B2
0.52mg
0.019mg
39%
Cholesterol
100mg
0mg
33%
Sodium
629mg
5mg
27%
Selenium
14.5µg
0µg
26%
Phosphorus
188mg
24mg
23%
Zinc
2.38mg
0.17mg
20%
Monounsaturated fat
8.013g
0.031g
20%
Calcium
184mg
10mg
17%
Calories
334kcal
18kcal
16%
Vitamin C
0mg
13.7mg
15%
Vitamin A
174µg
42µg
15%
Folate
65µg
15µg
13%
Vitamin B5
0.69mg
0.089mg
12%
Vitamin B6
0.235mg
0.08mg
12%
Fiber
0g
1.2g
5%
Vitamin K
2.3µg
7.9µg
5%
Polyunsaturated fat
0.826g
0.083g
5%
Copper
0.019mg
0.059mg
4%
Vitamin D*
20 IU
0 IU
3%
Vitamin D
0.5µg
0µg
3%
Potassium
152mg
237mg
3%
Iron
0.5mg
0.27mg
3%
Manganese
0.034mg
0.114mg
3%
Vitamin B1
0.07mg
0.037mg
3%
Magnesium
20mg
11mg
2%
Vitamin E
0.24mg
0.54mg
2%
Choline
15.4mg
6.7mg
2%
Fructose
1.37g
2%
Carbs
0.45g
3.89g
1%
Vitamin B3
0.38mg
0.594mg
1%
Protein per 100 calories
6.2g
4.9g
N/A
Calories per 10 g protein
161kcal
205kcal
N/A
Weight per 100 calories
30g
556g
N/A
Unsaturated / Saturated Fat ratio
0.51
4.1
N/A
Net carbs
0.45g
2.69g
N/A
Sugar
0.45g
2.63g
N/A
Tryptophan
0.322mg
0.006mg
0%
Threonine
0.751mg
0.027mg
0%
Isoleucine
1.015mg
0.018mg
0%
Leucine
1.929mg
0.025mg
0%
Lysine
1.851mg
0.027mg
0%
Methionine
0.592mg
0.006mg
0%
Phenylalanine
1.158mg
0.027mg
0%
Valine
1.34mg
0.018mg
0%
Histidine
0.716mg
0.014mg
0%
Macronutrient Comparison
Macronutrient breakdown side-by-side comparison
3
21%
28%
48%
3%
Protein:
20.75 g
Fats:
27.68 g
Carbs:
0.45 g
Water:
48.42 g
Other:
2.7 g
2
4%
95%
Protein:
0.88 g
Fats:
0.2 g
Carbs:
3.89 g
Water:
94.52 g
Other:
0.51 g
Contains
more
Protein Protein
+2258%
Contains
more
Fats Fats
+13740%
Contains
more
Other Other
+429.4%
Contains
more
Carbs Carbs
+764.4%
Contains
more
Water Water
+95.2%
Fat Type Comparison
Fat type breakdown side-by-side comparison
2
66%
31%
3%
Saturated fat:
Sat. Fat
17.41 g
Monounsaturated fat:
Mono. Fat
8.013 g
Polyunsaturated fat:
Poly. Fat
0.826 g
1
20%
22%
58%
Saturated fat:
Sat. Fat
0.028 g
Monounsaturated fat:
Mono. Fat
0.031 g
Polyunsaturated fat:
Poly. Fat
0.083 g
Contains
more
Mono. Fat Monounsaturated fat
+25748.4%
Contains
more
Poly. Fat Polyunsaturated fat
+895.2%
Contains
less
Sat. Fat Saturated fat
-99.8%