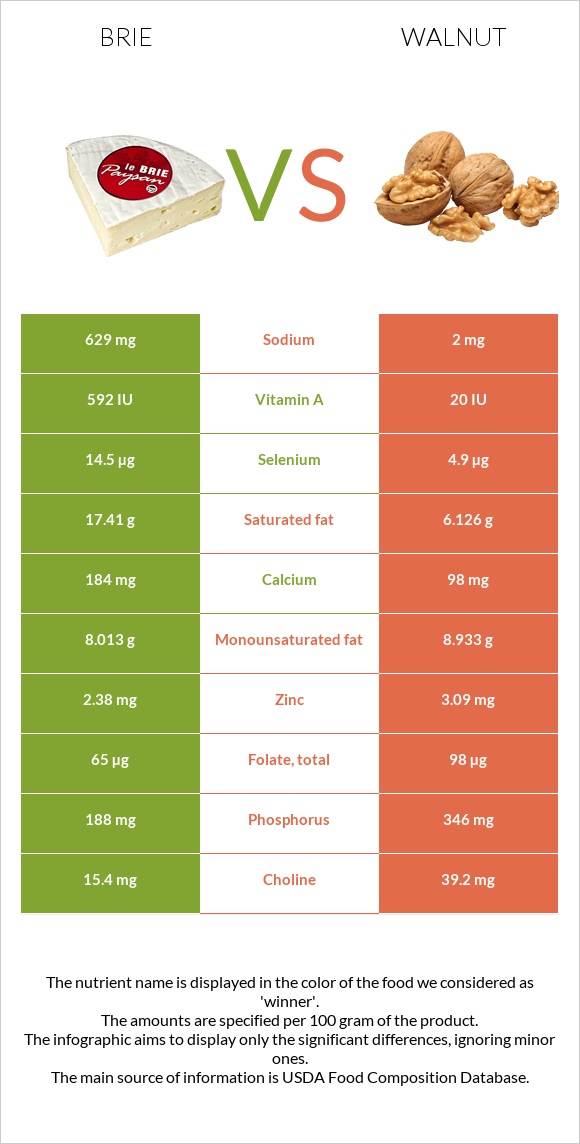
Differences between brie and walnut Brie has more vitamin B12 and vitamin B2, while walnut has more copper, manganese, magnesium, iron, and fiber. Walnut's daily need coverage for copper is 174% higher. The amount of cholesterol in walnut is lower. The food types used in this comparison are Cheese, brie and Nuts, walnuts, english .
Infographic
Mineral Comparison
Mineral comparison score is based on the number of minerals by which one or the other food is richer. The "coverage" charts below show how much of the daily needs can be covered by 300 grams of the food.
2
100 g
300 g
1 cubic inch - 17g 1 oz - 28.35g 1 package (4.5 oz) - 128g 1 cup, sliced - 144g 1 cup, melted - 240g
Magnesium
Magnesium
Calcium
Calcium
Potassium
Potassium
Iron
Iron
Copper
Copper
Zinc
Zinc
Phosphorus
Phosphorus
Sodium
Sodium
Manganese
Manganese
Selenium
Selenium
14%
55%
13%
19%
6.3%
65%
81%
82%
4.4%
79%
8
100 g
300 g
1 cup, in shell, edible yield (7 nuts) - 28g 1 oz (14 halves) - 28.35g 1 cup, ground - 80g 1 cup, chopped - 117g 1 cup pieces or chips - 120g
Magnesium
Magnesium
Calcium
Calcium
Potassium
Potassium
Iron
Iron
Copper
Copper
Zinc
Zinc
Phosphorus
Phosphorus
Sodium
Sodium
Manganese
Manganese
Selenium
Selenium
113%
29%
39%
109%
529%
84%
148%
0.26%
445%
27%
Vitamin Comparison
Vitamin comparison score is based on the number of vitamins by which one or the other food is richer. The "coverage" charts below show how much of the daily needs can be covered by 300 grams of the food.
5
100 g
300 g
1 cubic inch - 17g 1 oz - 28.35g 1 package (4.5 oz) - 128g 1 cup, sliced - 144g 1 cup, melted - 240g
Vitamin C
Vit. C
Vitamin D
Vit. D
Vitamin A
Vit. A
Vitamin E
Vit. E
Vitamin B1
Vit. B1
Vitamin B2
Vit. B2
Vitamin B3
Vit. B3
Vitamin B5
Vit. B5
Vitamin B6
Vit. B6
Vitamin B12
Vit. B12
Vitamin K
Vit. K
Folate
Folate
0%
7.5%
58%
4.8%
18%
120%
7.1%
41%
54%
206%
5.8%
49%
7
100 g
300 g
1 cup, in shell, edible yield (7 nuts) - 28g 1 oz (14 halves) - 28.35g 1 cup, ground - 80g 1 cup, chopped - 117g 1 cup pieces or chips - 120g
Vitamin C
Vit. C
Vitamin D
Vit. D
Vitamin A
Vit. A
Vitamin E
Vit. E
Vitamin B1
Vit. B1
Vitamin B2
Vit. B2
Vitamin B3
Vit. B3
Vitamin B5
Vit. B5
Vitamin B6
Vit. B6
Vitamin B12
Vit. B12
Vitamin K
Vit. K
Folate
Folate
4.3%
0%
0.33%
14%
85%
35%
21%
34%
124%
0%
6.8%
74%
All nutrients comparison - raw data values
Nutrient
DV% diff.
Polyunsaturated fat
0.826g
47.174g
309%
Copper
0.019mg
1.586mg
174%
Manganese
0.034mg
3.414mg
147%
Vitamin B12
1.65µg
0µg
69%
Fats
27.68g
65.21g
58%
Saturated fat
17.41g
6.126g
51%
Cholesterol
100mg
0mg
33%
Magnesium
20mg
158mg
33%
Iron
0.5mg
2.91mg
30%
Vitamin B2
0.52mg
0.15mg
28%
Fiber
0g
6.7g
27%
Sodium
629mg
2mg
27%
Phosphorus
188mg
346mg
23%
Vitamin B1
0.07mg
0.341mg
23%
Vitamin B6
0.235mg
0.537mg
23%
Vitamin A
174µg
1µg
19%
Selenium
14.5µg
4.9µg
17%
Calories
334kcal
654kcal
16%
Protein
20.75g
15.23g
11%
Calcium
184mg
98mg
9%
Potassium
152mg
441mg
9%
Folate
65µg
98µg
8%
Zinc
2.38mg
3.09mg
6%
Vitamin B3
0.38mg
1.125mg
5%
Carbs
0.45g
13.71g
4%
Choline
15.4mg
39.2mg
4%
Vitamin D*
20 IU
0 IU
3%
Vitamin D
0.5µg
0µg
3%
Vitamin E
0.24mg
0.7mg
3%
Vitamin B5
0.69mg
0.57mg
2%
Monounsaturated fat
8.013g
8.933g
2%
Vitamin C
0mg
1.3mg
1%
Protein per 100 calories
6.2g
2.3g
N/A
Calories per 10 g protein
161kcal
429kcal
N/A
Weight per 100 calories
30g
15g
N/A
Unsaturated / Saturated Fat ratio
0.51
9.2
N/A
Net carbs
0.45g
7.01g
N/A
Sugar
0.45g
2.61g
N/A
Starch
0.06g
0%
Vitamin K
2.3µg
2.7µg
0%
Tryptophan
0.322mg
0.17mg
0%
Threonine
0.751mg
0.596mg
0%
Isoleucine
1.015mg
0.625mg
0%
Leucine
1.929mg
1.17mg
0%
Lysine
1.851mg
0.424mg
0%
Methionine
0.592mg
0.236mg
0%
Phenylalanine
1.158mg
0.711mg
0%
Valine
1.34mg
0.753mg
0%
Histidine
0.716mg
0.391mg
0%
Fructose
0.09g
0%
Macronutrient Comparison
Macronutrient breakdown side-by-side comparison
3
21%
28%
48%
3%
Protein:
20.75 g
Fats:
27.68 g
Carbs:
0.45 g
Water:
48.42 g
Other:
2.7 g
2
15%
65%
14%
4%
2%
Protein:
15.23 g
Fats:
65.21 g
Carbs:
13.71 g
Water:
4.07 g
Other:
1.78 g
Contains
more
Protein Protein
+36.2%
Contains
more
Water Water
+1089.7%
Contains
more
Other Other
+51.7%
Contains
more
Fats Fats
+135.6%
Contains
more
Carbs Carbs
+2946.7%
Fat Type Comparison
Fat type breakdown side-by-side comparison
0
66%
31%
3%
Saturated fat:
Sat. Fat
17.41 g
Monounsaturated fat:
Mono. Fat
8.013 g
Polyunsaturated fat:
Poly. Fat
0.826 g
3
10%
14%
76%
Saturated fat:
Sat. Fat
6.126 g
Monounsaturated fat:
Mono. Fat
8.933 g
Polyunsaturated fat:
Poly. Fat
47.174 g
Contains
less
Sat. Fat Saturated fat
-64.8%
Contains
more
Mono. Fat Monounsaturated fat
+11.5%
Contains
more
Poly. Fat Polyunsaturated fat
+5611.1%