Butter vs. Butter, salted — In-Depth Nutrition Comparison
Compare
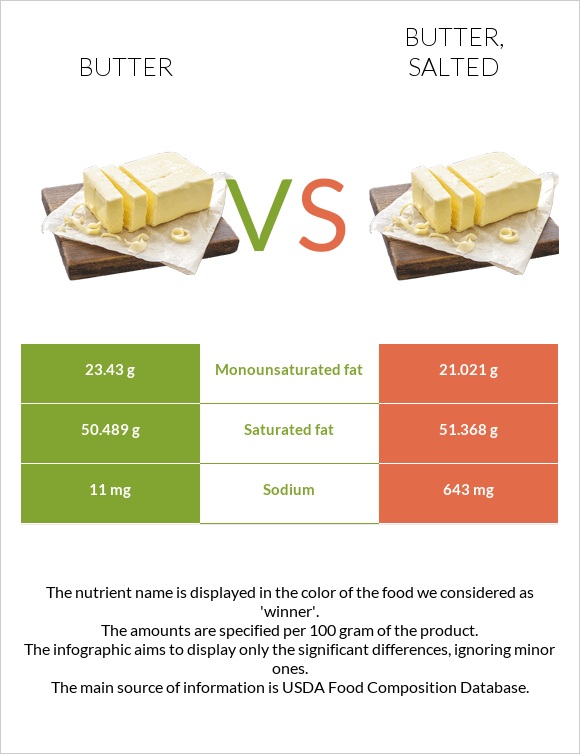
What are the main differences between butter and butter, salted?
- Butter, salted has less monounsaturated fat than butter.
- Butter, salted's daily need coverage for sodium is 27% higher.
- Butter contains less saturated fat.
We used Butter, without salt and Butter, salted types in this comparison.
Infographic
Infographic link
Mineral Comparison
Mineral comparison score is based on the number of minerals by which one or the other food is richer. The "coverage" charts below show how much of the daily needs can be covered by 300 grams of the food.
| Contains more CopperCopper | +∞% |
| Contains less SodiumSodium | -98.3% |
| Contains more ManganeseManganese | +∞% |
Vitamin Comparison
Vitamin comparison score is based on the number of vitamins by which one or the other food is richer. The "coverage" charts below show how much of the daily needs can be covered by 300 grams of the food.
All nutrients comparison - raw data values
| Nutrient |  |
|
DV% diff. |
| Sodium | 11mg | 643mg | 27% |
| Monounsaturated fat | 23.43g | 21.021g | 6% |
| Saturated fat | 50.489g | 51.368g | 4% |
| Copper | 0.016mg | 0mg | 2% |
| Calories | 717kcal | 717kcal | 0% |
| Protein | 0.85g | 0.85g | 0% |
| Fats | 81.11g | 81.11g | 0% |
| Net carbs | 0.06g | 0.06g | N/A |
| Carbs | 0.06g | 0.06g | 0% |
| Cholesterol | 215mg | 215mg | 0% |
| Magnesium | 2mg | 2mg | 0% |
| Calcium | 24mg | 24mg | 0% |
| Potassium | 24mg | 24mg | 0% |
| Iron | 0.02mg | 0.02mg | 0% |
| Sugar | 0.06g | 0.06g | N/A |
| Zinc | 0.09mg | 0.09mg | 0% |
| Phosphorus | 24mg | 24mg | 0% |
| Vitamin A | 684µg | 684µg | 0% |
| Vitamin E | 2.32mg | 2.32mg | 0% |
| Manganese | 0.004mg | 0mg | 0% |
| Selenium | 1µg | 1µg | 0% |
| Vitamin B1 | 0.005mg | 0.005mg | 0% |
| Vitamin B2 | 0.034mg | 0.034mg | 0% |
| Vitamin B3 | 0.042mg | 0.042mg | 0% |
| Vitamin B5 | 0.11mg | 0.11mg | 0% |
| Vitamin B6 | 0.003mg | 0.003mg | 0% |
| Vitamin B12 | 0.17µg | 0.17µg | 0% |
| Vitamin K | 7µg | 7µg | 0% |
| Folate | 3µg | 3µg | 0% |
| Trans fat | 3.278g | N/A | |
| Choline | 18.8mg | 18.8mg | 0% |
| Polyunsaturated fat | 3.01g | 3.043g | 0% |
| Tryptophan | 0.012mg | 0.012mg | 0% |
| Threonine | 0.038mg | 0.038mg | 0% |
| Isoleucine | 0.051mg | 0.051mg | 0% |
| Leucine | 0.083mg | 0.083mg | 0% |
| Lysine | 0.067mg | 0.067mg | 0% |
| Methionine | 0.021mg | 0.021mg | 0% |
| Phenylalanine | 0.041mg | 0.041mg | 0% |
| Valine | 0.057mg | 0.057mg | 0% |
| Histidine | 0.023mg | 0.023mg | 0% |
| Omega-3 - ALA | 0.315g | 0.315g | N/A |
| Omega-6 - Linoleic acid | 2.166g | 2.166g | N/A |
Macronutrient Comparison
Macronutrient breakdown side-by-side comparison
Protein:
0.85 g
Fats:
81.11 g
Carbs:
0.06 g
Water:
17.94 g
Other:
0.04 g
Protein:
0.85 g
Fats:
81.11 g
Carbs:
0.06 g
Water:
15.87 g
Other:
2.11 g
| Contains more WaterWater | +13% |
| Contains more OtherOther | +5175% |
~equal in
Protein
~0.85g
~equal in
Fats
~81.11g
~equal in
Carbs
~0.06g
Fat Type Comparison
Fat type breakdown side-by-side comparison
Saturated fat:
Sat. Fat
50.489 g
Monounsaturated fat:
Mono. Fat
23.43 g
Polyunsaturated fat:
Poly. Fat
3.01 g
Saturated fat:
Sat. Fat
51.368 g
Monounsaturated fat:
Mono. Fat
21.021 g
Polyunsaturated fat:
Poly. Fat
3.043 g
| Contains more Mono. FatMonounsaturated fat | +11.5% |
~equal in
Saturated fat
~51.368g
~equal in
Polyunsaturated fat
~3.043g