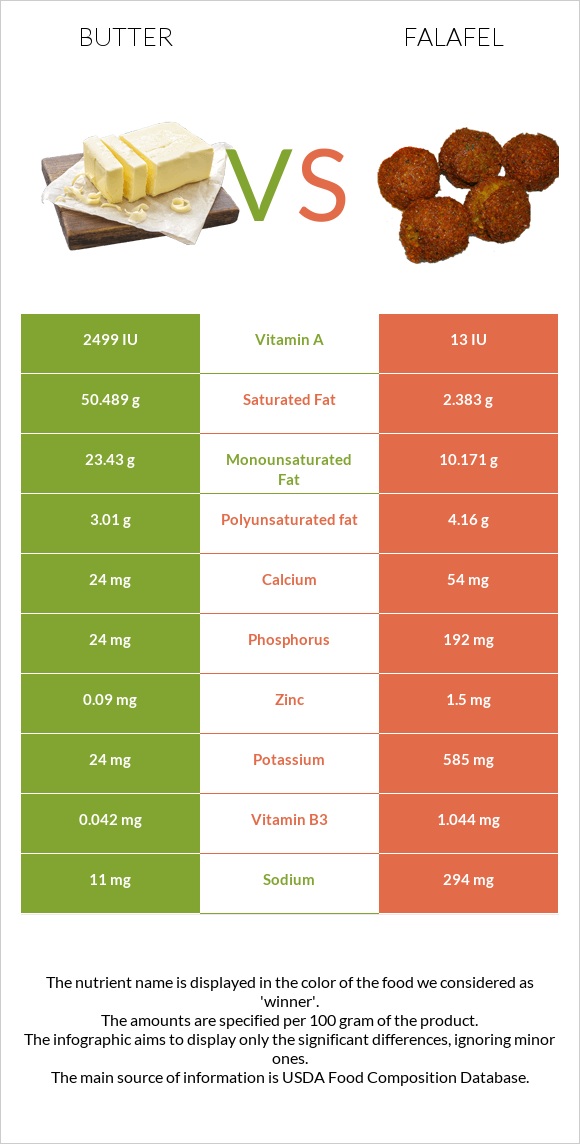
Summary of differences between butter and falafel Butter has more vitamin A; however, falafel is higher in iron, manganese, copper, phosphorus, folate, magnesium, and potassium. Butter covers your daily need for saturated fat, 241% more than falafel. The glycemic index of falafel is higher. These are the specific foods used in this comparison Butter, without salt and Falafel, home-prepared .
Infographic
Mineral Comparison
Mineral comparison score is based on the number of minerals by which one or the other food is richer. The "coverage" charts below show how much of the daily needs can be covered by 300 grams of the food.
1
100 g
300 g
1 pat (1" sq, 1/3" high) - 5g 1 tbsp - 14.2g 1 stick - 113g 1 cup - 227g
Magnesium
Magnesium
Calcium
Calcium
Potassium
Potassium
Iron
Iron
Copper
Copper
Zinc
Zinc
Phosphorus
Phosphorus
Sodium
Sodium
Manganese
Manganese
Selenium
Selenium
1.4%
7.2%
2.1%
0.75%
5.3%
2.5%
10%
1.4%
0.52%
5.5%
8
100 g
300 g
1 patty (approx 2-1/4" dia) - 17g
Magnesium
Magnesium
Calcium
Calcium
Potassium
Potassium
Iron
Iron
Copper
Copper
Zinc
Zinc
Phosphorus
Phosphorus
Sodium
Sodium
Manganese
Manganese
Selenium
Selenium
59%
16%
52%
128%
86%
41%
82%
38%
90%
5.5%
Vitamin Comparison
Vitamin comparison score is based on the number of vitamins by which one or the other food is richer. The "coverage" charts below show how much of the daily needs can be covered by 300 grams of the food.
4
100 g
300 g
1 pat (1" sq, 1/3" high) - 5g 1 tbsp - 14.2g 1 stick - 113g 1 cup - 227g
Vitamin C
Vit. C
Vitamin D
Vit. D
Vitamin A
Vit. A
Vitamin E
Vit. E
Vitamin B1
Vit. B1
Vitamin B2
Vit. B2
Vitamin B3
Vit. B3
Vitamin B5
Vit. B5
Vitamin B6
Vit. B6
Vitamin B12
Vit. B12
Vitamin K
Vit. K
Folate
Folate
0%
0%
228%
46%
1.3%
7.8%
0.79%
6.6%
0.69%
21%
18%
2.3%
7
100 g
300 g
1 patty (approx 2-1/4" dia) - 17g
Vitamin C
Vit. C
Vitamin D
Vit. D
Vitamin A
Vit. A
Vitamin E
Vit. E
Vitamin B1
Vit. B1
Vitamin B2
Vit. B2
Vitamin B3
Vit. B3
Vitamin B5
Vit. B5
Vitamin B6
Vit. B6
Vitamin B12
Vit. B12
Vitamin K
Vit. K
Folate
Folate
5.3%
0%
0.33%
0%
37%
38%
20%
18%
29%
0%
0%
70%
All nutrients comparison - raw data values
Nutrient
DV% diff.
Saturated fat
50.489g
2.383g
219%
Fats
81.11g
17.8g
97%
Vitamin A
684µg
1µg
76%
Cholesterol
215mg
0mg
72%
Iron
0.02mg
3.42mg
43%
Monounsaturated fat
23.43g
10.171g
33%
Manganese
0.004mg
0.691mg
30%
Copper
0.016mg
0.258mg
27%
Protein
0.85g
13.31g
25%
Phosphorus
24mg
192mg
24%
Folate
3µg
93µg
23%
Calories
717kcal
333kcal
19%
Magnesium
2mg
82mg
19%
Potassium
24mg
585mg
17%
Vitamin E
2.32mg
15%
Zinc
0.09mg
1.5mg
13%
Sodium
11mg
294mg
12%
Vitamin B1
0.005mg
0.146mg
12%
Carbs
0.06g
31.84g
11%
Vitamin B2
0.034mg
0.166mg
10%
Vitamin B6
0.003mg
0.125mg
9%
Polyunsaturated fat
3.01g
4.16g
8%
Vitamin B12
0.17µg
0µg
7%
Vitamin B3
0.042mg
1.044mg
6%
Vitamin K
7µg
6%
Vitamin B5
0.11mg
0.292mg
4%
Calcium
24mg
54mg
3%
Choline
18.8mg
3%
Vitamin C
0mg
1.6mg
2%
Protein per 100 calories
0.12g
4g
N/A
Calories per 10 g protein
8435kcal
250kcal
N/A
Weight per 100 calories
14g
30g
N/A
Unsaturated / Saturated Fat ratio
0.52
6
N/A
Net carbs
0.06g
31.84g
N/A
Sugar
0.06g
N/A
Selenium
1µg
1µg
0%
Tryptophan
0.012mg
0.134mg
0%
Threonine
0.038mg
0.492mg
0%
Isoleucine
0.051mg
0.567mg
0%
Leucine
0.083mg
0.944mg
0%
Lysine
0.067mg
0.856mg
0%
Methionine
0.021mg
0.187mg
0%
Phenylalanine
0.041mg
0.707mg
0%
Valine
0.057mg
0.562mg
0%
Histidine
0.023mg
0.364mg
0%
Omega-3 - ALA
0.315g
N/A
Omega-6 - Linoleic acid
2.166g
N/A
Macronutrient Comparison
Macronutrient breakdown side-by-side comparison
1
81%
18%
Protein:
0.85 g
Fats:
81.11 g
Carbs:
0.06 g
Water:
17.94 g
Other:
0.04 g
4
13%
18%
32%
35%
2%
Protein:
13.31 g
Fats:
17.8 g
Carbs:
31.84 g
Water:
34.62 g
Other:
2.43 g
Contains
more
Fats Fats
+355.7%
Contains
more
Protein Protein
+1465.9%
Contains
more
Carbs Carbs
+52966.7%
Contains
more
Water Water
+93%
Contains
more
Other Other
+5975%
Fat Type Comparison
Fat type breakdown side-by-side comparison
1
66%
30%
4%
Saturated fat:
Sat. Fat
50.489 g
Monounsaturated fat:
Mono. Fat
23.43 g
Polyunsaturated fat:
Poly. Fat
3.01 g
2
14%
61%
25%
Saturated fat:
Sat. Fat
2.383 g
Monounsaturated fat:
Mono. Fat
10.171 g
Polyunsaturated fat:
Poly. Fat
4.16 g
Contains
more
Mono. Fat Monounsaturated fat
+130.4%
Contains
less
Sat. Fat Saturated fat
-95.3%
Contains
more
Poly. Fat Polyunsaturated fat
+38.2%