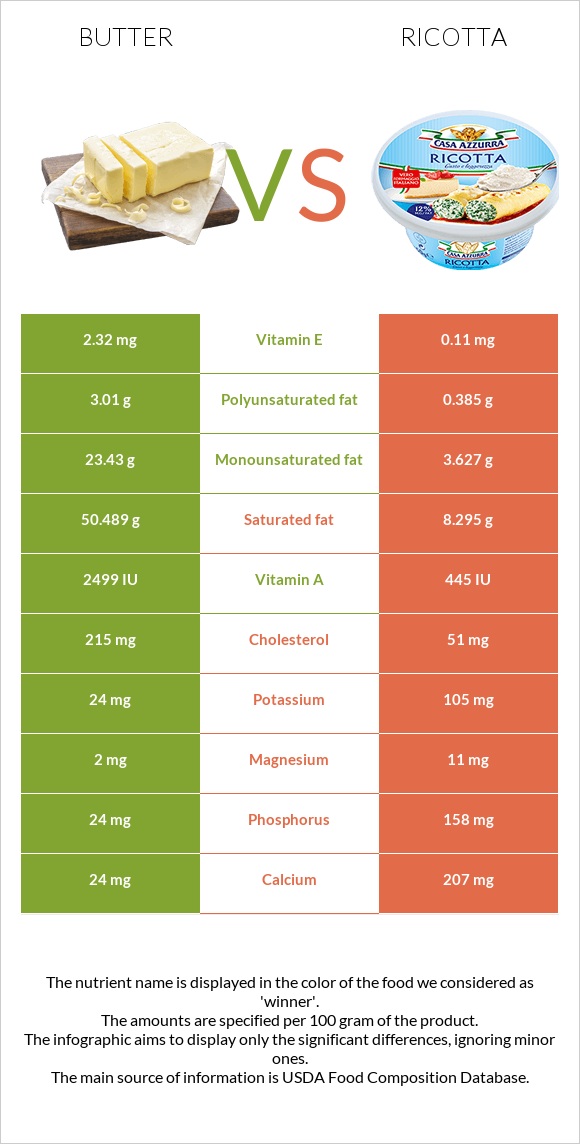
Differences between butter and ricotta Butter has more vitamin A and vitamin E, while ricotta has more selenium, phosphorus, calcium, vitamin B2, zinc, and vitamin B12. Butter's daily need coverage for saturated fat is 211% higher. Ricotta contains 21 times less vitamin E than butter. Butter contains 2.32mg of vitamin E, while ricotta contains 0.11mg. The amount of saturated fat in ricotta is lower. Butter has a lower glycemic index. The glycemic index of butter is 0, while the glycemic index of ricotta is 27. The food types used in this comparison are Butter, without salt and Cheese, ricotta, whole milk .
Infographic
Mineral Comparison
Mineral comparison score is based on the number of minerals by which one or the other food is richer. The "coverage" charts below show how much of the daily needs can be covered by 300 grams of the food.
1
100 g
300 g
1 pat (1" sq, 1/3" high) - 5g 1 tbsp - 14.2g 1 stick - 113g 1 cup - 227g
Magnesium
Magnesium
Calcium
Calcium
Potassium
Potassium
Iron
Iron
Copper
Copper
Zinc
Zinc
Phosphorus
Phosphorus
Sodium
Sodium
Manganese
Manganese
Selenium
Selenium
1.4%
7.2%
2.1%
0.75%
5.3%
2.5%
10%
1.4%
0.52%
5.5%
9
100 g
300 g
1 small cup - 55g 0.5 cup - 124g 1 cup - 246g
Magnesium
Magnesium
Calcium
Calcium
Potassium
Potassium
Iron
Iron
Copper
Copper
Zinc
Zinc
Phosphorus
Phosphorus
Sodium
Sodium
Manganese
Manganese
Selenium
Selenium
7.9%
62%
9.3%
14%
7%
32%
68%
11%
0.78%
79%
Vitamin Comparison
Vitamin comparison score is based on the number of vitamins by which one or the other food is richer. The "coverage" charts below show how much of the daily needs can be covered by 300 grams of the food.
3
100 g
300 g
1 pat (1" sq, 1/3" high) - 5g 1 tbsp - 14.2g 1 stick - 113g 1 cup - 227g
Vitamin C
Vit. C
Vitamin D
Vit. D
Vitamin A
Vit. A
Vitamin E
Vit. E
Vitamin B1
Vit. B1
Vitamin B2
Vit. B2
Vitamin B3
Vit. B3
Vitamin B5
Vit. B5
Vitamin B6
Vit. B6
Vitamin B12
Vit. B12
Vitamin K
Vit. K
Folate
Folate
0%
0%
228%
46%
1.3%
7.8%
0.79%
6.6%
0.69%
21%
18%
2.3%
8
100 g
300 g
1 small cup - 55g 0.5 cup - 124g 1 cup - 246g
Vitamin C
Vit. C
Vitamin D
Vit. D
Vitamin A
Vit. A
Vitamin E
Vit. E
Vitamin B1
Vit. B1
Vitamin B2
Vit. B2
Vitamin B3
Vit. B3
Vitamin B5
Vit. B5
Vitamin B6
Vit. B6
Vitamin B12
Vit. B12
Vitamin K
Vit. K
Folate
Folate
0%
3%
40%
2.2%
3.3%
45%
2%
13%
9.9%
43%
2.8%
9%
All nutrients comparison - raw data values
Nutrient
DV% diff.
Saturated fat
50.489g
8.295g
192%
Fats
81.11g
12.98g
105%
Vitamin A
684µg
120µg
63%
Cholesterol
215mg
51mg
55%
Monounsaturated fat
23.43g
3.627g
50%
Calories
717kcal
174kcal
27%
Selenium
1µg
14.5µg
25%
Protein
0.85g
11.26g
21%
Phosphorus
24mg
158mg
19%
Calcium
24mg
207mg
18%
Polyunsaturated fat
3.01g
0.385g
18%
Vitamin E
2.32mg
0.11mg
15%
Vitamin B2
0.034mg
0.195mg
12%
Zinc
0.09mg
1.16mg
10%
Vitamin B12
0.17µg
0.34µg
7%
Iron
0.02mg
0.38mg
5%
Vitamin K
7µg
1.1µg
5%
Sodium
11mg
84mg
3%
Vitamin B6
0.003mg
0.043mg
3%
Magnesium
2mg
11mg
2%
Potassium
24mg
105mg
2%
Vitamin B5
0.11mg
0.213mg
2%
Folate
3µg
12µg
2%
Carbs
0.06g
3.04g
1%
Vitamin D*
0 IU
10 IU
1%
Vitamin D
0µg
0.2µg
1%
Copper
0.016mg
0.021mg
1%
Vitamin B1
0.005mg
0.013mg
1%
Protein per 100 calories
0.12g
6.5g
N/A
Calories per 10 g protein
8435kcal
155kcal
N/A
Weight per 100 calories
14g
57g
N/A
Unsaturated / Saturated Fat ratio
0.52
0.48
N/A
Net carbs
0.06g
3.04g
N/A
Sugar
0.06g
0.27g
N/A
Manganese
0.004mg
0.006mg
0%
Vitamin B3
0.042mg
0.104mg
0%
Choline
18.8mg
17.5mg
0%
Tryptophan
0.012mg
0.125mg
0%
Threonine
0.038mg
0.517mg
0%
Isoleucine
0.051mg
0.589mg
0%
Leucine
0.083mg
1.221mg
0%
Lysine
0.067mg
1.338mg
0%
Methionine
0.021mg
0.281mg
0%
Phenylalanine
0.041mg
0.556mg
0%
Valine
0.057mg
0.692mg
0%
Histidine
0.023mg
0.459mg
0%
Omega-3 - ALA
0.315g
N/A
Omega-6 - Linoleic acid
2.166g
N/A
Macronutrient Comparison
Macronutrient breakdown side-by-side comparison
1
81%
18%
Protein:
0.85 g
Fats:
81.11 g
Carbs:
0.06 g
Water:
17.94 g
Other:
0.04 g
4
11%
13%
3%
72%
Protein:
11.26 g
Fats:
12.98 g
Carbs:
3.04 g
Water:
71.7 g
Other:
1.02 g
Contains
more
Fats Fats
+524.9%
Contains
more
Protein Protein
+1224.7%
Contains
more
Carbs Carbs
+4966.7%
Contains
more
Water Water
+299.7%
Contains
more
Other Other
+2450%
Fat Type Comparison
Fat type breakdown side-by-side comparison
2
66%
30%
4%
Saturated fat:
Sat. Fat
50.489 g
Monounsaturated fat:
Mono. Fat
23.43 g
Polyunsaturated fat:
Poly. Fat
3.01 g
1
67%
29%
3%
Saturated fat:
Sat. Fat
8.295 g
Monounsaturated fat:
Mono. Fat
3.627 g
Polyunsaturated fat:
Poly. Fat
0.385 g
Contains
more
Mono. Fat Monounsaturated fat
+546%
Contains
more
Poly. Fat Polyunsaturated fat
+681.8%
Contains
less
Sat. Fat Saturated fat
-83.6%