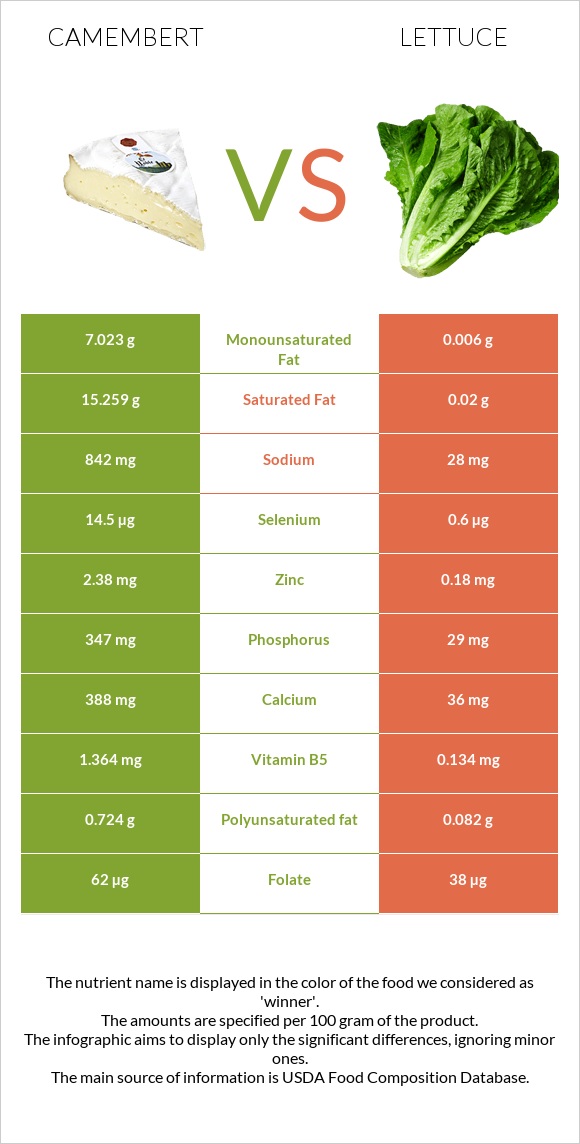
Significant differences between camembert and lettuce Camembert has more vitamin B12, phosphorus, calcium, vitamin B2, selenium, and vitamin B5; however, lettuce is richer in vitamin A and vitamin K. Lettuce covers your daily vitamin A needs 132% more than camembert. Lettuce contains less saturated fat. Specific food types used in this comparison are Cheese, camembert and Lettuce, green leaf, raw .
Infographic
Mineral Comparison
Mineral comparison score is based on the number of minerals by which one or the other food is richer. The "coverage" charts below show how much of the daily needs can be covered by 300 grams of the food.
5
100 g
300 g
1 cubic inch - 17g 1 oz - 28.35g 1 wedge (1.33 oz) - 38g 1 cup - 246g
Magnesium
Magnesium
Calcium
Calcium
Potassium
Potassium
Iron
Iron
Copper
Copper
Zinc
Zinc
Phosphorus
Phosphorus
Sodium
Sodium
Manganese
Manganese
Selenium
Selenium
14%
116%
17%
12%
7%
65%
149%
110%
5%
79%
4
100 g
300 g
1 leaf inner - 4.8g 1 leaf outer - 24g 1 cup shredded - 36g 1 head - 360g
Magnesium
Magnesium
Calcium
Calcium
Potassium
Potassium
Iron
Iron
Copper
Copper
Zinc
Zinc
Phosphorus
Phosphorus
Sodium
Sodium
Manganese
Manganese
Selenium
Selenium
9.3%
11%
17%
32%
9.7%
4.9%
12%
3.7%
33%
3.3%
Vitamin Comparison
Vitamin comparison score is based on the number of vitamins by which one or the other food is richer. The "coverage" charts below show how much of the daily needs can be covered by 300 grams of the food.
7
100 g
300 g
1 cubic inch - 17g 1 oz - 28.35g 1 wedge (1.33 oz) - 38g 1 cup - 246g
Vitamin C
Vit. C
Vitamin D
Vit. D
Vitamin A
Vit. A
Vitamin E
Vit. E
Vitamin B1
Vit. B1
Vitamin B2
Vit. B2
Vitamin B3
Vit. B3
Vitamin B5
Vit. B5
Vitamin B6
Vit. B6
Vitamin B12
Vit. B12
Vitamin K
Vit. K
Folate
Folate
0%
6%
80%
4.2%
7%
113%
12%
82%
52%
163%
5%
47%
4
100 g
300 g
1 leaf inner - 4.8g 1 leaf outer - 24g 1 cup shredded - 36g 1 head - 360g
Vitamin C
Vit. C
Vitamin D
Vit. D
Vitamin A
Vit. A
Vitamin E
Vit. E
Vitamin B1
Vit. B1
Vitamin B2
Vit. B2
Vitamin B3
Vit. B3
Vitamin B5
Vit. B5
Vitamin B6
Vit. B6
Vitamin B12
Vit. B12
Vitamin K
Vit. K
Folate
Folate
31%
0%
123%
4.4%
18%
18%
7%
8%
21%
0%
316%
29%
All nutrients comparison - raw data values
Nutrient
DV% diff.
Vitamin K
2µg
126.3µg
104%
Saturated fat
15.259g
0.02g
69%
Vitamin B12
1.3µg
0µg
54%
Phosphorus
347mg
29mg
45%
Protein
19.8g
1.36g
37%
Fats
24.26g
0.15g
37%
Calcium
388mg
36mg
35%
Sodium
842mg
28mg
35%
Vitamin B2
0.488mg
0.08mg
31%
Selenium
14.5µg
0.6µg
25%
Vitamin B5
1.364mg
0.134mg
25%
Cholesterol
72mg
0mg
24%
Zinc
2.38mg
0.18mg
20%
Monounsaturated fat
7.023g
0.006g
18%
Calories
300kcal
15kcal
14%
Vitamin A
241µg
370µg
14%
Vitamin B6
0.227mg
0.09mg
11%
Vitamin C
0mg
9.2mg
10%
Manganese
0.038mg
0.25mg
9%
Iron
0.33mg
0.86mg
7%
Folate
62µg
38µg
6%
Fiber
0g
1.3g
5%
Vitamin B1
0.028mg
0.07mg
4%
Polyunsaturated fat
0.724g
0.082g
4%
Vitamin D*
18 IU
0 IU
2%
Vitamin D
0.4µg
0µg
2%
Magnesium
20mg
13mg
2%
Vitamin B3
0.63mg
0.375mg
2%
Carbs
0.46g
2.87g
1%
Copper
0.021mg
0.029mg
1%
Fructose
0.43g
1%
Protein per 100 calories
6.6g
9.1g
N/A
Calories per 10 g protein
152kcal
110kcal
N/A
Weight per 100 calories
33g
667g
N/A
Unsaturated / Saturated Fat ratio
0.51
4.4
N/A
Net carbs
0.46g
1.57g
N/A
Potassium
187mg
194mg
0%
Sugar
0.46g
0.78g
N/A
Vitamin E
0.21mg
0.22mg
0%
Choline
15.4mg
13.6mg
0%
Tryptophan
0.307mg
0.009mg
0%
Threonine
0.717mg
0.059mg
0%
Isoleucine
0.968mg
0.084mg
0%
Leucine
1.84mg
0.079mg
0%
Lysine
1.766mg
0.084mg
0%
Methionine
0.565mg
0.016mg
0%
Phenylalanine
1.105mg
0.055mg
0%
Valine
1.279mg
0.07mg
0%
Histidine
0.683mg
0.022mg
0%
Macronutrient Comparison
Macronutrient breakdown side-by-side comparison
3
20%
24%
52%
4%
Protein:
19.8 g
Fats:
24.26 g
Carbs:
0.46 g
Water:
51.8 g
Other:
3.68 g
2
3%
95%
Protein:
1.36 g
Fats:
0.15 g
Carbs:
2.87 g
Water:
94.98 g
Other:
0.64 g
Contains
more
Protein Protein
+1355.9%
Contains
more
Fats Fats
+16073.3%
Contains
more
Other Other
+475%
Contains
more
Carbs Carbs
+523.9%
Contains
more
Water Water
+83.4%
Fat Type Comparison
Fat type breakdown side-by-side comparison
2
66%
31%
3%
Saturated fat:
Sat. Fat
15.259 g
Monounsaturated fat:
Mono. Fat
7.023 g
Polyunsaturated fat:
Poly. Fat
0.724 g
1
19%
6%
76%
Saturated fat:
Sat. Fat
0.02 g
Monounsaturated fat:
Mono. Fat
0.006 g
Polyunsaturated fat:
Poly. Fat
0.082 g
Contains
more
Mono. Fat Monounsaturated fat
+116950%
Contains
more
Poly. Fat Polyunsaturated fat
+782.9%
Contains
less
Sat. Fat Saturated fat
-99.9%