Canola oil vs. Olive oil — In-Depth Nutrition Comparison
Compare
A recap on the differences between canola oil and olive oil
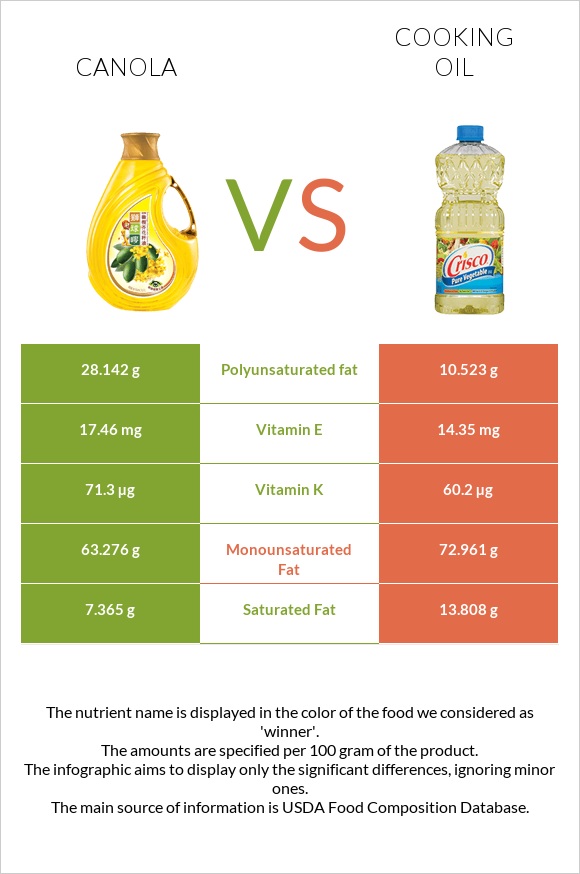
- Canola oil has more vitamin E, vitamin K, and polyunsaturated fat; however, olive oil is higher in iron and monounsaturated fat.
- Olive oil covers your daily saturated fat needs 32% more than canola oil.
- Olive oil contains 3 times less polyunsaturated fat than canola oil. Canola oil contains 28.142g of polyunsaturated fat, while olive oil contains 10.523g.
- Canola oil has less saturated fat.
Food varieties used in this article are Oil, canola and Oil, olive, salad or cooking.
Infographic
Infographic link
Mineral Comparison
Mineral comparison score is based on the number of minerals by which one or the other food is richer. The "coverage" charts below show how much of the daily needs can be covered by 300 grams of the food.
| Contains less SodiumSodium | -100% |
| Contains more CalciumCalcium | +∞% |
| Contains more PotassiumPotassium | +∞% |
| Contains more IronIron | +∞% |
Vitamin Comparison
Vitamin comparison score is based on the number of vitamins by which one or the other food is richer. The "coverage" charts below show how much of the daily needs can be covered by 300 grams of the food.
| Contains more Vitamin EVitamin E | +21.7% |
| Contains more Vitamin KVitamin K | +18.4% |
All nutrients comparison - raw data values
| Nutrient |  |
 |
DV% diff. |
| Polyunsaturated fat | 28.142g | 10.523g | 117% |
| Saturated fat | 7.365g | 13.808g | 29% |
| Monounsaturated fat | 63.276g | 72.961g | 24% |
| Vitamin E | 17.46mg | 14.35mg | 21% |
| Vitamin K | 71.3µg | 60.2µg | 9% |
| Iron | 0mg | 0.56mg | 7% |
| Calories | 884kcal | 884kcal | 0% |
| Weight per 100 calories | 11g | 11g | N/A |
| Fats | 100g | 100g | 0% |
| Unsaturated / Saturated Fat ratio | 12 | 6 | N/A |
| Calcium | 0mg | 1mg | 0% |
| Potassium | 0mg | 1mg | 0% |
| Sodium | 0mg | 2mg | 0% |
| Trans fat | 0.395g | N/A | |
| Choline | 0.2mg | 0.3mg | 0% |
| Omega-3 - ALA | 9.137g | N/A | |
| Omega-6 - Linoleic acid | 18.64g | N/A |
Macronutrient Comparison
Macronutrient breakdown side-by-side comparison
Protein:
0 g
Fats:
100 g
Carbs:
0 g
Water:
0 g
Other:
0 g
Protein:
0 g
Fats:
100 g
Carbs:
0 g
Water:
0 g
Other:
0 g
~equal in
Protein
~0g
~equal in
Fats
~100g
~equal in
Carbs
~0g
~equal in
Water
~0g
~equal in
Other
~0g
Fat Type Comparison
Fat type breakdown side-by-side comparison
Saturated fat:
Sat. Fat
7.365 g
Monounsaturated fat:
Mono. Fat
63.276 g
Polyunsaturated fat:
Poly. Fat
28.142 g
Saturated fat:
Sat. Fat
13.808 g
Monounsaturated fat:
Mono. Fat
72.961 g
Polyunsaturated fat:
Poly. Fat
10.523 g
| Contains less Sat. FatSaturated fat | -46.7% |
| Contains more Poly. FatPolyunsaturated fat | +167.4% |
| Contains more Mono. FatMonounsaturated fat | +15.3% |


