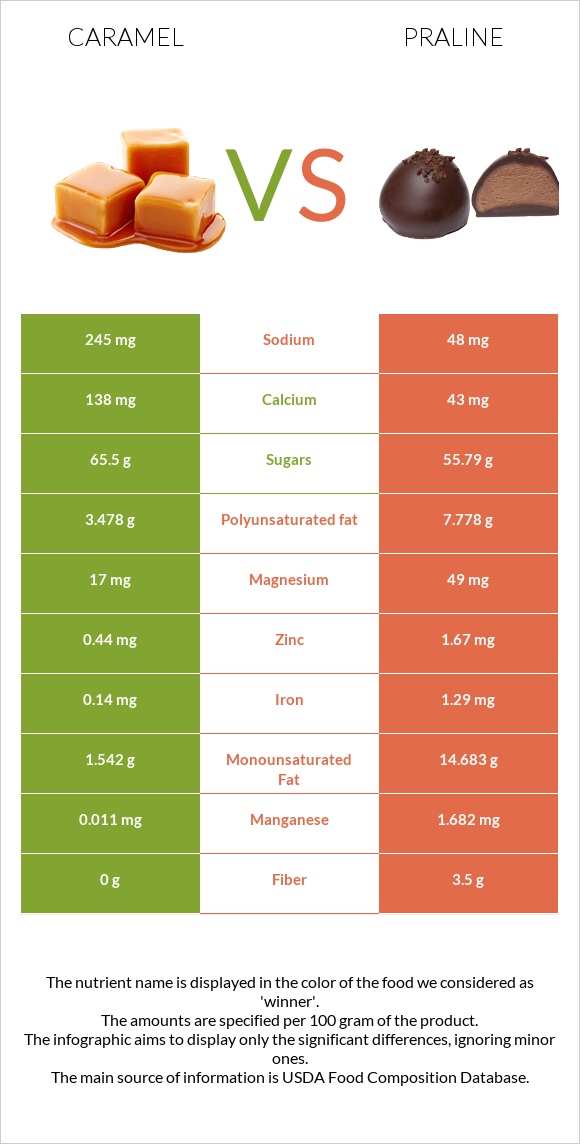
Significant differences between caramel and praline Caramel has more vitamin B2, vitamin B12, and calcium; however, praline is richer in manganese, copper, iron, fiber, zinc, and vitamin B1. Praline covers your daily manganese needs 73% more than caramel. Praline contains less sodium. Caramel has a higher glycemic index. The glycemic index of caramel is 65, while the glycemic index of praline is 43. Specific food types used in this comparison are Candies, caramels and Candies, praline, prepared-from-recipe .
Infographic
Mineral Comparison
Mineral comparison score is based on the number of minerals by which one or the other food is richer. The "coverage" charts below show how much of the daily needs can be covered by 300 grams of the food.
1
100 g
300 g
1 piece - 10.1g 1 package (2.5 oz) - 71g
Magnesium
Magnesium
Calcium
Calcium
Potassium
Potassium
Iron
Iron
Copper
Copper
Zinc
Zinc
Phosphorus
Phosphorus
Sodium
Sodium
Manganese
Manganese
Selenium
Selenium
12%
41%
19%
5.3%
6%
12%
49%
32%
1.4%
9.8%
6
100 g
300 g
1 piece - 39g 1 recipe yield - 907g
Magnesium
Magnesium
Calcium
Calcium
Potassium
Potassium
Iron
Iron
Copper
Copper
Zinc
Zinc
Phosphorus
Phosphorus
Sodium
Sodium
Manganese
Manganese
Selenium
Selenium
35%
13%
19%
48%
165%
46%
45%
6.3%
219%
9.8%
Vitamin Comparison
Vitamin comparison score is based on the number of vitamins by which one or the other food is richer. The "coverage" charts below show how much of the daily needs can be covered by 300 grams of the food.
6
100 g
300 g
1 piece - 10.1g 1 package (2.5 oz) - 71g
Vitamin C
Vit. C
Vitamin D
Vit. D
Vitamin A
Vit. A
Vitamin E
Vit. E
Vitamin B1
Vit. B1
Vitamin B2
Vit. B2
Vitamin B3
Vit. B3
Vitamin B5
Vit. B5
Vitamin B6
Vit. B6
Vitamin B12
Vit. B12
Vitamin K
Vit. K
Folate
Folate
1.3%
0%
4%
9.2%
26%
59%
2.8%
37%
13%
38%
4.5%
3%
4
100 g
300 g
1 piece - 39g 1 recipe yield - 907g
Vitamin C
Vit. C
Vitamin D
Vit. D
Vitamin A
Vit. A
Vitamin E
Vit. E
Vitamin B1
Vit. B1
Vitamin B2
Vit. B2
Vitamin B3
Vit. B3
Vitamin B5
Vit. B5
Vitamin B6
Vit. B6
Vitamin B12
Vit. B12
Vitamin K
Vit. K
Folate
Folate
1%
0%
0.33%
10%
51%
12%
7.8%
20%
18%
0%
3.3%
4.5%
All nutrients comparison - raw data values
Nutrient
DV% diff.
Manganese
0.011mg
1.682mg
73%
Copper
0.018mg
0.494mg
53%
Monounsaturated fat
1.542g
14.683g
33%
Polyunsaturated fat
3.478g
7.778g
29%
Fats
8.1g
25.9g
27%
Vitamin B2
0.256mg
0.053mg
16%
Iron
0.14mg
1.29mg
14%
Fiber
0g
3.5g
14%
Vitamin B12
0.3µg
0µg
13%
Zinc
0.44mg
1.67mg
11%
Calcium
138mg
43mg
10%
Sodium
245mg
48mg
9%
Magnesium
17mg
49mg
8%
Vitamin B1
0.103mg
0.203mg
8%
Carbs
77g
59.59g
6%
Vitamin B5
0.62mg
0.332mg
6%
Calories
382kcal
485kcal
5%
Protein
4.6g
3.3g
3%
Cholesterol
7mg
0mg
2%
Vitamin B3
0.148mg
0.415mg
2%
Vitamin B6
0.056mg
0.077mg
2%
Phosphorus
114mg
104mg
1%
Vitamin A
12µg
1µg
1%
Folate
4µg
6µg
1%
Choline
8mg
1%
Saturated fat
2.476g
2.224g
1%
Protein per 100 calories
1.2g
0.68g
N/A
Calories per 10 g protein
830kcal
1470kcal
N/A
Weight per 100 calories
26g
21g
N/A
Unsaturated / Saturated Fat ratio
2
10
N/A
Vitamin C
0.4mg
0.3mg
0%
Net carbs
77g
56.09g
N/A
Potassium
214mg
217mg
0%
Sugar
65.5g
55.79g
N/A
Vitamin E
0.46mg
0.5mg
0%
Selenium
1.8µg
1.8µg
0%
Vitamin K
1.8µg
1.3µg
0%
Tryptophan
0.06mg
0%
Threonine
0.192mg
0%
Isoleucine
0.258mg
0%
Leucine
0.417mg
0%
Lysine
0.338mg
0%
Methionine
0.107mg
0%
Phenylalanine
0.205mg
0%
Valine
0.285mg
0%
Histidine
0.115mg
0%
Macronutrient Comparison
Macronutrient breakdown side-by-side comparison
3
5%
8%
77%
9%
2%
Protein:
4.6 g
Fats:
8.1 g
Carbs:
77 g
Water:
8.5 g
Other:
1.8 g
2
3%
26%
60%
10%
Protein:
3.3 g
Fats:
25.9 g
Carbs:
59.59 g
Water:
10.36 g
Other:
0.85 g
Contains
more
Protein Protein
+39.4%
Contains
more
Carbs Carbs
+29.2%
Contains
more
Other Other
+111.8%
Contains
more
Fats Fats
+219.8%
Contains
more
Water Water
+21.9%
Fat Type Comparison
Fat type breakdown side-by-side comparison
0
33%
21%
46%
Saturated fat:
Sat. Fat
2.476 g
Monounsaturated fat:
Mono. Fat
1.542 g
Polyunsaturated fat:
Poly. Fat
3.478 g
3
9%
59%
32%
Saturated fat:
Sat. Fat
2.224 g
Monounsaturated fat:
Mono. Fat
14.683 g
Polyunsaturated fat:
Poly. Fat
7.778 g
Contains
less
Sat. Fat Saturated fat
-10.2%
Contains
more
Mono. Fat Monounsaturated fat
+852.2%
Contains
more
Poly. Fat Polyunsaturated fat
+123.6%