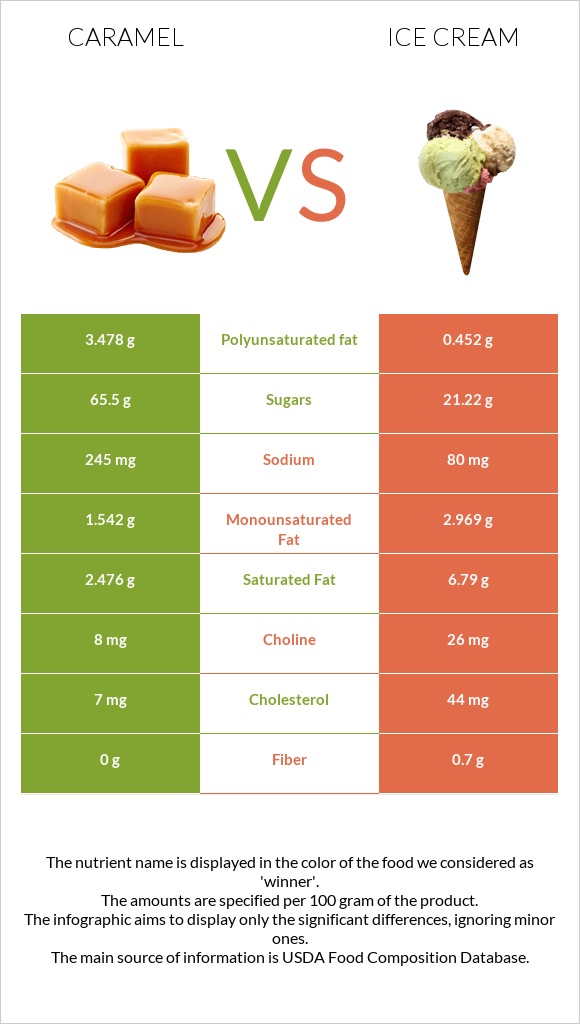
How are caramel and ice cream different? Caramel is higher in vitamin B1 and polyunsaturated fat; however, ice cream is richer in vitamin A and monounsaturated fat. Daily need coverage for saturated fat for ice cream is 22% higher. Caramel contains 8 times more polyunsaturated fat than ice cream. While caramel contains 3.478g of polyunsaturated fat, ice cream contains only 0.452g. Ice cream has less sugar. Candies, caramels and Ice creams, vanilla are the varieties used in this article.
Infographic
Mineral Comparison
Mineral comparison score is based on the number of minerals by which one or the other food is richer. The "coverage" charts below show how much of the daily needs can be covered by 300 grams of the food.
3
100 g
300 g
1 piece - 10.1g 1 package (2.5 oz) - 71g
Magnesium
Magnesium
Calcium
Calcium
Potassium
Potassium
Iron
Iron
Copper
Copper
Zinc
Zinc
Phosphorus
Phosphorus
Sodium
Sodium
Manganese
Manganese
Selenium
Selenium
12%
41%
19%
5.3%
6%
12%
49%
32%
1.4%
9.8%
3
100 g
300 g
1 serving 1/2 cup - 66g
Magnesium
Magnesium
Calcium
Calcium
Potassium
Potassium
Iron
Iron
Copper
Copper
Zinc
Zinc
Phosphorus
Phosphorus
Sodium
Sodium
Manganese
Manganese
Selenium
Selenium
10%
38%
18%
3.4%
7.7%
19%
45%
10%
1%
9.8%
Vitamin Comparison
Vitamin comparison score is based on the number of vitamins by which one or the other food is richer. The "coverage" charts below show how much of the daily needs can be covered by 300 grams of the food.
5
100 g
300 g
1 piece - 10.1g 1 package (2.5 oz) - 71g
Vitamin C
Vit. C
Vitamin D
Vit. D
Vitamin A
Vit. A
Vitamin E
Vit. E
Vitamin B1
Vit. B1
Vitamin B2
Vit. B2
Vitamin B3
Vit. B3
Vitamin B5
Vit. B5
Vitamin B6
Vit. B6
Vitamin B12
Vit. B12
Vitamin K
Vit. K
Folate
Folate
1.3%
0%
4%
9.2%
26%
59%
2.8%
37%
13%
38%
4.5%
3%
5
100 g
300 g
1 serving 1/2 cup - 66g
Vitamin C
Vit. C
Vitamin D
Vit. D
Vitamin A
Vit. A
Vitamin E
Vit. E
Vitamin B1
Vit. B1
Vitamin B2
Vit. B2
Vitamin B3
Vit. B3
Vitamin B5
Vit. B5
Vitamin B6
Vit. B6
Vitamin B12
Vit. B12
Vitamin K
Vit. K
Folate
Folate
2%
3%
39%
6%
10%
55%
2.2%
35%
11%
49%
0.75%
3.8%
All nutrients comparison - raw data values
Nutrient
DV% diff.
Saturated fat
2.476g
6.79g
20%
Polyunsaturated fat
3.478g
0.452g
20%
Carbs
77g
23.6g
18%
Cholesterol
7mg
44mg
12%
Vitamin A
12µg
118µg
12%
Calories
382kcal
207kcal
9%
Sodium
245mg
80mg
7%
Vitamin B1
0.103mg
0.041mg
5%
Fats
8.1g
11g
4%
Vitamin B12
0.3µg
0.39µg
4%
Monounsaturated fat
1.542g
2.969g
4%
Fiber
0g
0.7g
3%
Choline
8mg
26mg
3%
Protein
4.6g
3.5g
2%
Zinc
0.44mg
0.69mg
2%
Vitamin D*
0 IU
8 IU
1%
Vitamin D
0µg
0.2µg
1%
Magnesium
17mg
14mg
1%
Calcium
138mg
128mg
1%
Iron
0.14mg
0.09mg
1%
Copper
0.018mg
0.023mg
1%
Phosphorus
114mg
105mg
1%
Vitamin E
0.46mg
0.3mg
1%
Vitamin B2
0.256mg
0.24mg
1%
Vitamin B5
0.62mg
0.581mg
1%
Vitamin B6
0.056mg
0.048mg
1%
Vitamin K
1.8µg
0.3µg
1%
Protein per 100 calories
1.2g
1.7g
N/A
Calories per 10 g protein
830kcal
591kcal
N/A
Weight per 100 calories
26g
48g
N/A
Unsaturated / Saturated Fat ratio
2
0.5
N/A
Vitamin C
0.4mg
0.6mg
0%
Net carbs
77g
22.9g
N/A
Potassium
214mg
199mg
0%
Sugar
65.5g
21.22g
N/A
Manganese
0.011mg
0.008mg
0%
Selenium
1.8µg
1.8µg
0%
Vitamin B3
0.148mg
0.116mg
0%
Folate
4µg
5µg
0%
Tryptophan
0.06mg
0.045mg
0%
Threonine
0.192mg
0.146mg
0%
Isoleucine
0.258mg
0.195mg
0%
Leucine
0.417mg
0.316mg
0%
Lysine
0.338mg
0.258mg
0%
Methionine
0.107mg
0.081mg
0%
Phenylalanine
0.205mg
0.157mg
0%
Valine
0.285mg
0.217mg
0%
Histidine
0.115mg
0.088mg
0%
Omega-3 - EPA
0g
0.003g
N/A
Macronutrient Comparison
Macronutrient breakdown side-by-side comparison
3
5%
8%
77%
9%
2%
Protein:
4.6 g
Fats:
8.1 g
Carbs:
77 g
Water:
8.5 g
Other:
1.8 g
2
4%
11%
24%
61%
Protein:
3.5 g
Fats:
11 g
Carbs:
23.6 g
Water:
61 g
Other:
0.9 g
Contains
more
Protein Protein
+31.4%
Contains
more
Carbs Carbs
+226.3%
Contains
more
Other Other
+100%
Contains
more
Fats Fats
+35.8%
Contains
more
Water Water
+617.6%
Fat Type Comparison
Fat type breakdown side-by-side comparison
2
33%
21%
46%
Saturated fat:
Sat. Fat
2.476 g
Monounsaturated fat:
Mono. Fat
1.542 g
Polyunsaturated fat:
Poly. Fat
3.478 g
1
66%
29%
4%
Saturated fat:
Sat. Fat
6.79 g
Monounsaturated fat:
Mono. Fat
2.969 g
Polyunsaturated fat:
Poly. Fat
0.452 g
Contains
less
Sat. Fat Saturated fat
-63.5%
Contains
more
Poly. Fat Polyunsaturated fat
+669.5%
Contains
more
Mono. Fat Monounsaturated fat
+92.5%