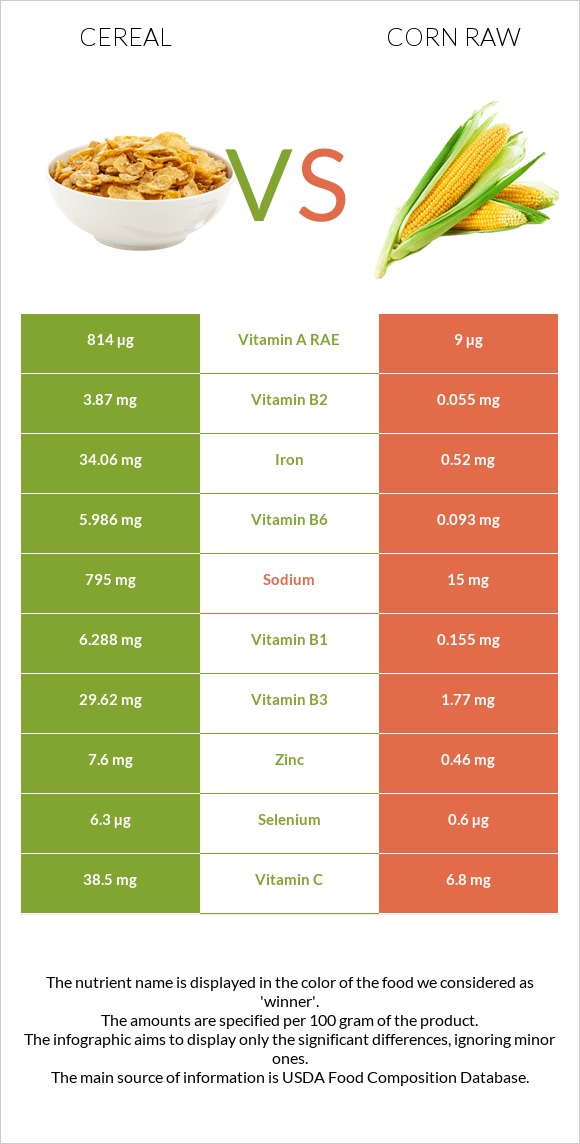
A recap on the differences between cereal and corn raw Cereal is higher than corn raw in vitamin B1, vitamin B6, iron, vitamin B2, vitamin B3, zinc, vitamin A, vitamin C, and manganese. Cereal covers your daily vitamin B1 needs 511% more than corn raw. Cereal contains 70 times more vitamin B2 than corn raw. While cereal contains 3.87mg of vitamin B2, corn raw contains only 0.055mg. The amount of sodium in corn raw is lower. The glycemic index of corn raw is lower. Food varieties used in this article are Cereals ready-to-eat, USDA Commodity Corn and Rice (includes all commodity brands) and Corn, sweet, yellow, raw .
Infographic
Mineral Comparison
Mineral comparison score is based on the number of minerals by which one or the other food is richer. The "coverage" charts below show how much of the daily needs can be covered by 300 grams of the food.
6
100 g
300 g
1 cup - 29g 1 serving (NLEA serving = 1 cup) - 29g
Magnesium
Magnesium
Calcium
Calcium
Potassium
Potassium
Iron
Iron
Copper
Copper
Zinc
Zinc
Phosphorus
Phosphorus
Sodium
Sodium
Manganese
Manganese
Selenium
Selenium
14%
3%
9.3%
1277%
46%
207%
33%
104%
103%
34%
4
100 g
300 g
1 ear, small (5-1/2" to 6-1/2" long) - 73g 1 ear, medium (6-3/4" to 7-1/2" long) yields - 102g 1 ear, large (7-3/4" to 9" long) yields - 143g 1 cup - 145g
Magnesium
Magnesium
Calcium
Calcium
Potassium
Potassium
Iron
Iron
Copper
Copper
Zinc
Zinc
Phosphorus
Phosphorus
Sodium
Sodium
Manganese
Manganese
Selenium
Selenium
26%
0.6%
24%
20%
18%
13%
38%
2%
21%
3.3%
Vitamin Comparison
Vitamin comparison score is based on the number of vitamins by which one or the other food is richer. The "coverage" charts below show how much of the daily needs can be covered by 300 grams of the food.
7
100 g
300 g
1 cup - 29g 1 serving (NLEA serving = 1 cup) - 29g
Vitamin C
Vit. C
Vitamin D
Vit. D
Vitamin A
Vit. A
Vitamin E
Vit. E
Vitamin B1
Vit. B1
Vitamin B2
Vit. B2
Vitamin B3
Vit. B3
Vitamin B5
Vit. B5
Vitamin B6
Vit. B6
Vitamin B12
Vit. B12
Vitamin K
Vit. K
Folate
Folate
128%
0%
271%
1.6%
1572%
893%
555%
14%
1381%
0%
0%
0%
3
100 g
300 g
1 ear, small (5-1/2" to 6-1/2" long) - 73g 1 ear, medium (6-3/4" to 7-1/2" long) yields - 102g 1 ear, large (7-3/4" to 9" long) yields - 143g 1 cup - 145g
Vitamin C
Vit. C
Vitamin D
Vit. D
Vitamin A
Vit. A
Vitamin E
Vit. E
Vitamin B1
Vit. B1
Vitamin B2
Vit. B2
Vitamin B3
Vit. B3
Vitamin B5
Vit. B5
Vitamin B6
Vit. B6
Vitamin B12
Vit. B12
Vitamin K
Vit. K
Folate
Folate
23%
0%
3%
1.4%
39%
13%
33%
43%
21%
0%
0.75%
32%
All nutrients comparison - raw data values
Nutrient
DV% diff.
Vitamin B1
6.288mg
0.155mg
511%
Vitamin B6
5.986mg
0.093mg
453%
Iron
34.06mg
0.52mg
419%
Vitamin B2
3.87mg
0.055mg
293%
Vitamin B3
29.62mg
1.77mg
174%
Vitamin A
814µg
9µg
89%
Zinc
7.6mg
0.46mg
65%
Vitamin C
38.5mg
6.8mg
35%
Sodium
795mg
15mg
34%
Manganese
0.79mg
0.163mg
27%
Carbs
86.85g
18.7g
23%
Calories
378kcal
86kcal
15%
Folate
42µg
11%
Selenium
6.3µg
0.6µg
10%
Vitamin B5
0.226mg
0.717mg
10%
Copper
0.137mg
0.054mg
9%
Protein
6.06g
3.27g
6%
Potassium
105mg
270mg
5%
Magnesium
19mg
37mg
4%
Choline
23mg
4%
Fiber
1.4g
2g
2%
Starch
5.7g
2%
Phosphorus
77mg
89mg
2%
Fructose
0.26g
1.94g
2%
Calcium
10mg
2mg
1%
Monounsaturated fat
0.204g
0.432g
1%
Polyunsaturated fat
0.354g
0.487g
1%
Protein per 100 calories
1.6g
3.8g
N/A
Calories per 10 g protein
624kcal
263kcal
N/A
Weight per 100 calories
26g
116g
N/A
Fats
1.08g
1.35g
0%
Net carbs
85.45g
16.7g
N/A
Sugar
10.35g
6.26g
N/A
Vitamin E
0.08mg
0.07mg
0%
Vitamin K
0µg
0.3µg
0%
Saturated fat
0.26g
0.325g
0%
Tryptophan
0.066mg
0.023mg
0%
Threonine
0.241mg
0.129mg
0%
Isoleucine
0.26mg
0.129mg
0%
Leucine
0.767mg
0.348mg
0%
Lysine
0.113mg
0.137mg
0%
Methionine
0.13mg
0.067mg
0%
Phenylalanine
0.365mg
0.15mg
0%
Valine
0.344mg
0.185mg
0%
Histidine
0.162mg
0.089mg
0%
Omega-3 - ALA
0.014g
N/A
Omega-6 - Linoleic acid
0.468g
N/A
Macronutrient Comparison
Macronutrient breakdown side-by-side comparison
3
6%
87%
4%
2%
Protein:
6.06 g
Fats:
1.08 g
Carbs:
86.85 g
Water:
3.78 g
Other:
2.23 g
2
3%
19%
76%
Protein:
3.27 g
Fats:
1.35 g
Carbs:
18.7 g
Water:
76.05 g
Other:
0.63 g
Contains
more
Protein Protein
+85.3%
Contains
more
Carbs Carbs
+364.4%
Contains
more
Other Other
+254%
Contains
more
Fats Fats
+25%
Contains
more
Water Water
+1911.9%
Fat Type Comparison
Fat type breakdown side-by-side comparison
1
32%
25%
43%
Saturated fat:
Sat. Fat
0.26 g
Monounsaturated fat:
Mono. Fat
0.204 g
Polyunsaturated fat:
Poly. Fat
0.354 g
2
26%
35%
39%
Saturated fat:
Sat. Fat
0.325 g
Monounsaturated fat:
Mono. Fat
0.432 g
Polyunsaturated fat:
Poly. Fat
0.487 g
Contains
less
Sat. Fat Saturated fat
-20%
Contains
more
Mono. Fat Monounsaturated fat
+111.8%
Contains
more
Poly. Fat Polyunsaturated fat
+37.6%
Carbohydrate type comparison
Carbohydrate type breakdown side-by-side comparison
2
94%
3%
3%
Starch:
0 g
Sucrose:
9.74 g
Glucose:
0.27 g
Fructose:
0.26 g
Lactose:
0 g
Maltose:
0.09 g
Galactose:
0 g
3
48%
7%
29%
16%
Starch:
5.7 g
Sucrose:
0.89 g
Glucose:
3.43 g
Fructose:
1.94 g
Lactose:
0 g
Maltose:
0 g
Galactose:
0 g
Contains
more
Sucrose Sucrose
+994.4%
Contains
more
Maltose Maltose
+∞%
Contains
more
Starch Starch
+∞%
Contains
more
Glucose Glucose
+1170.4%
Contains
more
Fructose Fructose
+646.2%
~equal in
Lactose
~0g
~equal in
Galactose
~0g