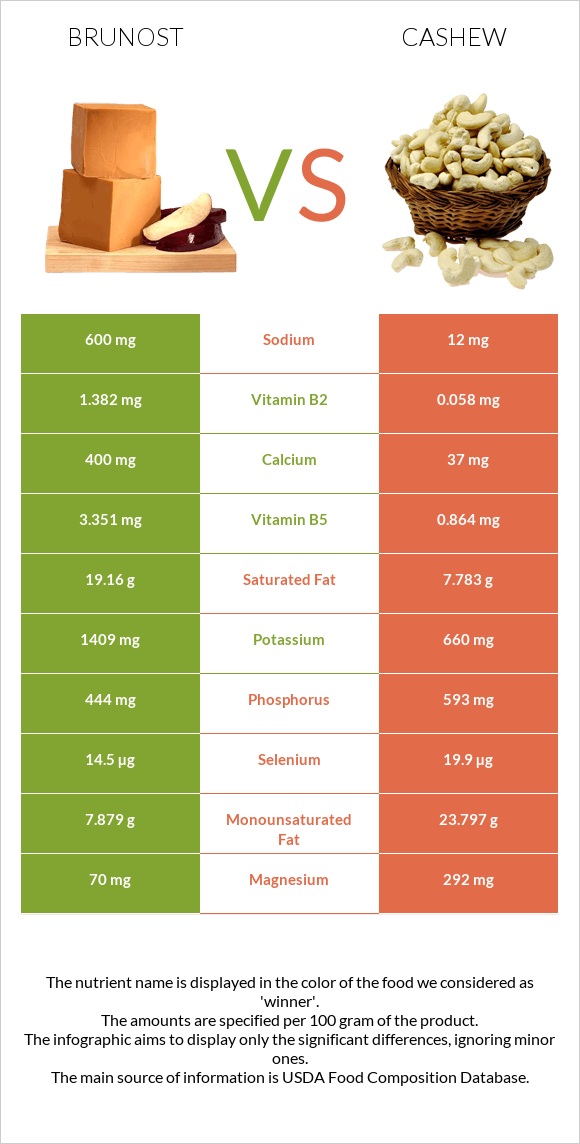
How are brunost and cashew different? Brunost is richer in vitamin B2, vitamin B12, vitamin B5, and calcium, while cashew is higher in copper, iron, manganese, magnesium, and zinc. Cashew covers your daily need for copper, 235% more than brunost. Cashew is lower in saturated fat. Cheese, gjetost and Nuts, cashew nuts, raw types were used in this article.
Infographic
Mineral Comparison
Mineral comparison score is based on the number of minerals by which one or the other food is richer. The "coverage" charts below show how much of the daily needs can be covered by 300 grams of the food.
2
100 g
300 g
1 oz - 28.35g 1 package (8 oz) - 227g
Magnesium
Magnesium
Calcium
Calcium
Potassium
Potassium
Iron
Iron
Copper
Copper
Zinc
Zinc
Phosphorus
Phosphorus
Sodium
Sodium
Manganese
Manganese
Selenium
Selenium
50%
120%
124%
20%
27%
31%
190%
78%
5.2%
79%
8
100 g
300 g
1 oz - 28.35g
Magnesium
Magnesium
Calcium
Calcium
Potassium
Potassium
Iron
Iron
Copper
Copper
Zinc
Zinc
Phosphorus
Phosphorus
Sodium
Sodium
Manganese
Manganese
Selenium
Selenium
209%
11%
58%
251%
732%
158%
254%
1.6%
216%
109%
Vitamin Comparison
Vitamin comparison score is based on the number of vitamins by which one or the other food is richer. The "coverage" charts below show how much of the daily needs can be covered by 300 grams of the food.
4
100 g
300 g
1 oz - 28.35g 1 package (8 oz) - 227g
Vitamin C
Vit. C
Vitamin D
Vit. D
Vitamin A
Vit. A
Vitamin E
Vit. E
Vitamin B1
Vit. B1
Vitamin B2
Vit. B2
Vitamin B3
Vit. B3
Vitamin B5
Vit. B5
Vitamin B6
Vit. B6
Vitamin B12
Vit. B12
Vitamin K
Vit. K
Folate
Folate
0%
0%
111%
0%
79%
319%
15%
201%
63%
303%
0%
3.8%
7
100 g
300 g
1 oz - 28.35g
Vitamin C
Vit. C
Vitamin D
Vit. D
Vitamin A
Vit. A
Vitamin E
Vit. E
Vitamin B1
Vit. B1
Vitamin B2
Vit. B2
Vitamin B3
Vit. B3
Vitamin B5
Vit. B5
Vitamin B6
Vit. B6
Vitamin B12
Vit. B12
Vitamin K
Vit. K
Folate
Folate
1.7%
0%
0%
18%
106%
13%
20%
52%
96%
0%
85%
19%
All nutrients comparison - raw data values
Nutrient
DV% diff.
Copper
0.08mg
2.195mg
235%
Vitamin B2
1.382mg
0.058mg
102%
Vitamin B12
2.42µg
0µg
101%
Iron
0.52mg
6.68mg
77%
Manganese
0.04mg
1.655mg
70%
Magnesium
70mg
292mg
53%
Saturated fat
19.16g
7.783g
52%
Vitamin B5
3.351mg
0.864mg
50%
Polyunsaturated fat
0.938g
7.845g
46%
Zinc
1.14mg
5.78mg
42%
Monounsaturated fat
7.879g
23.797g
40%
Vitamin A
334µg
0µg
37%
Calcium
400mg
37mg
36%
Cholesterol
94mg
0mg
31%
Vitamin K
34.1µg
28%
Sodium
600mg
12mg
26%
Fats
29.51g
43.85g
22%
Potassium
1409mg
660mg
22%
Phosphorus
444mg
593mg
21%
Protein
9.65g
18.22g
17%
Fiber
0g
3.3g
13%
Vitamin B6
0.271mg
0.417mg
11%
Starch
23.49g
10%
Selenium
14.5µg
19.9µg
10%
Vitamin B1
0.315mg
0.423mg
9%
Vitamin E
0.9mg
6%
Folate
5µg
25µg
5%
Calories
466kcal
553kcal
4%
Carbs
42.65g
30.19g
4%
Vitamin B3
0.813mg
1.062mg
2%
Vitamin C
0mg
0.5mg
1%
Protein per 100 calories
2.1g
3.3g
N/A
Calories per 10 g protein
483kcal
304kcal
N/A
Weight per 100 calories
21g
18g
N/A
Unsaturated / Saturated Fat ratio
0.46
4.1
N/A
Net carbs
42.65g
26.89g
N/A
Sugar
5.91g
N/A
Tryptophan
0.135mg
0.287mg
0%
Threonine
0.393mg
0.688mg
0%
Isoleucine
0.519mg
0.789mg
0%
Leucine
0.992mg
1.472mg
0%
Lysine
0.814mg
0.928mg
0%
Methionine
0.318mg
0.362mg
0%
Phenylalanine
0.54mg
0.951mg
0%
Valine
0.765mg
1.094mg
0%
Histidine
0.293mg
0.456mg
0%
Fructose
0.05g
0%
Macronutrient Comparison
Macronutrient breakdown side-by-side comparison
3
10%
30%
43%
13%
5%
Protein:
9.65 g
Fats:
29.51 g
Carbs:
42.65 g
Water:
13.44 g
Other:
4.75 g
2
18%
44%
30%
5%
3%
Protein:
18.22 g
Fats:
43.85 g
Carbs:
30.19 g
Water:
5.2 g
Other:
2.54 g
Contains
more
Carbs Carbs
+41.3%
Contains
more
Water Water
+158.5%
Contains
more
Other Other
+87%
Contains
more
Protein Protein
+88.8%
Contains
more
Fats Fats
+48.6%
Fat Type Comparison
Fat type breakdown side-by-side comparison
0
68%
28%
3%
Saturated fat:
Sat. Fat
19.16 g
Monounsaturated fat:
Mono. Fat
7.879 g
Polyunsaturated fat:
Poly. Fat
0.938 g
3
20%
60%
20%
Saturated fat:
Sat. Fat
7.783 g
Monounsaturated fat:
Mono. Fat
23.797 g
Polyunsaturated fat:
Poly. Fat
7.845 g
Contains
less
Sat. Fat Saturated fat
-59.4%
Contains
more
Mono. Fat Monounsaturated fat
+202%
Contains
more
Poly. Fat Polyunsaturated fat
+736.4%