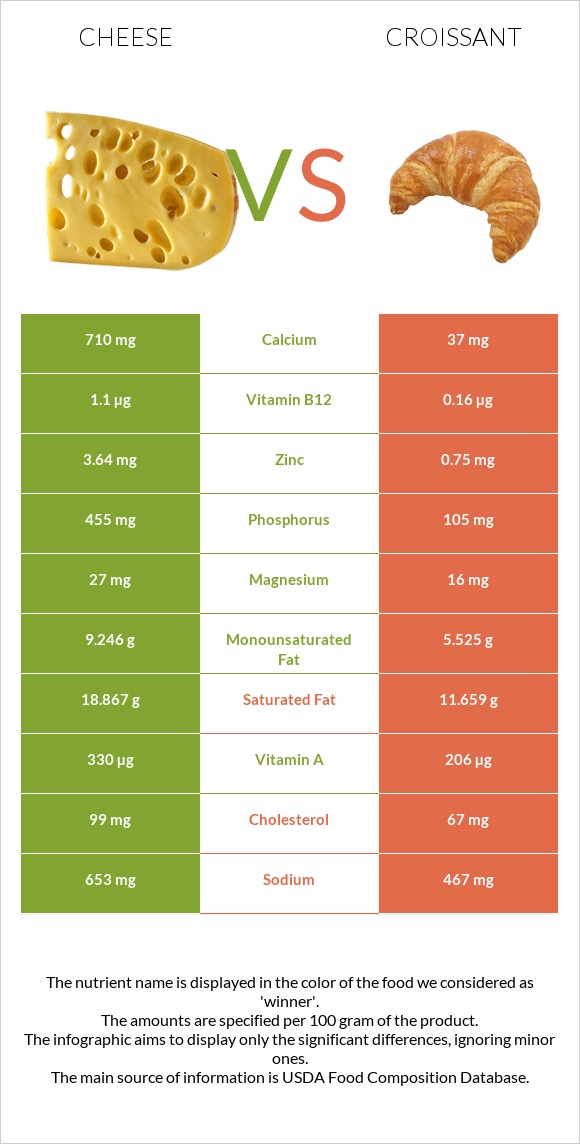
How are cheese and croissant different? Cheese has more calcium, phosphorus, vitamin B12, zinc, and vitamin B2; however, croissant is richer in vitamin B1, iron, folate, and vitamin B3. Cheese covers your daily need for calcium, 67% more than croissant. Cheese has 7 times more vitamin B12 than croissant. Cheese has 1.1µg of vitamin B12, while croissant has 0.16µg. Croissant contains less saturated fat. Croissant has a higher glycemic index. The glycemic index of croissant is 56, while the glycemic index of cheese is 0. Cheese, cheddar and Croissants, butter types were used in this article.
Infographic
Mineral Comparison
Mineral comparison score is based on the number of minerals by which one or the other food is richer. The "coverage" charts below show how much of the daily needs can be covered by 300 grams of the food.
5
100 g
300 g
1 cubic inch - 17g 1 slice (1 oz) - 28g 1 oz - 28.35g 1 cup, shredded - 113g 1 cup, diced - 132g 1 cup, melted - 244g
Magnesium
Magnesium
Calcium
Calcium
Potassium
Potassium
Iron
Iron
Copper
Copper
Zinc
Zinc
Phosphorus
Phosphorus
Sodium
Sodium
Manganese
Manganese
Selenium
Selenium
19%
213%
6.7%
5.3%
10%
99%
195%
85%
3.5%
155%
5
100 g
300 g
1 croissant, mini - 28g 1 oz - 28.35g 1 croissant, small - 42g 1 croissant, medium - 57g 1 croissant, large - 67g
Magnesium
Magnesium
Calcium
Calcium
Potassium
Potassium
Iron
Iron
Copper
Copper
Zinc
Zinc
Phosphorus
Phosphorus
Sodium
Sodium
Manganese
Manganese
Selenium
Selenium
11%
11%
10%
76%
27%
20%
45%
61%
43%
124%
Vitamin Comparison
Vitamin comparison score is based on the number of vitamins by which one or the other food is richer. The "coverage" charts below show how much of the daily needs can be covered by 300 grams of the food.
6
100 g
300 g
1 cubic inch - 17g 1 slice (1 oz) - 28g 1 oz - 28.35g 1 cup, shredded - 113g 1 cup, diced - 132g 1 cup, melted - 244g
Vitamin C
Vit. C
Vitamin D
Vit. D
Vitamin A
Vit. A
Vitamin E
Vit. E
Vitamin B1
Vit. B1
Vitamin B2
Vit. B2
Vitamin B3
Vit. B3
Vitamin B5
Vit. B5
Vitamin B6
Vit. B6
Vitamin B12
Vit. B12
Vitamin K
Vit. K
Folate
Folate
0%
9%
110%
14%
7.3%
99%
1.1%
25%
15%
138%
6%
20%
6
100 g
300 g
1 croissant, mini - 28g 1 oz - 28.35g 1 croissant, small - 42g 1 croissant, medium - 57g 1 croissant, large - 67g
Vitamin C
Vit. C
Vitamin D
Vit. D
Vitamin A
Vit. A
Vitamin E
Vit. E
Vitamin B1
Vit. B1
Vitamin B2
Vit. B2
Vitamin B3
Vit. B3
Vitamin B5
Vit. B5
Vitamin B6
Vit. B6
Vitamin B12
Vit. B12
Vitamin K
Vit. K
Folate
Folate
0.67%
0%
69%
17%
97%
56%
41%
52%
13%
20%
4.5%
66%
All nutrients comparison - raw data values
Nutrient
DV% diff.
Calcium
710mg
37mg
67%
Phosphorus
455mg
105mg
50%
Vitamin B12
1.1µg
0.16µg
39%
Saturated fat
18.867g
11.659g
33%
Vitamin B1
0.029mg
0.388mg
30%
Protein
22.87g
8.2g
29%
Zinc
3.64mg
0.75mg
26%
Iron
0.14mg
2.03mg
24%
Fats
33.31g
21g
19%
Folate
27µg
88µg
15%
Carbs
3.09g
45.8g
14%
Vitamin A
330µg
206µg
14%
Vitamin B2
0.428mg
0.241mg
14%
Manganese
0.027mg
0.33mg
13%
Vitamin B3
0.059mg
2.188mg
13%
Cholesterol
99mg
67mg
11%
Selenium
28.5µg
22.7µg
11%
Fiber
0g
2.6g
10%
Vitamin B5
0.41mg
0.861mg
9%
Monounsaturated fat
9.246g
5.525g
9%
Sodium
653mg
467mg
8%
Copper
0.03mg
0.08mg
6%
Choline
16.5mg
38.8mg
4%
Vitamin D*
24 IU
0 IU
3%
Vitamin D
0.6µg
0µg
3%
Magnesium
27mg
16mg
3%
Polyunsaturated fat
1.421g
1.094g
2%
Potassium
76mg
118mg
1%
Vitamin E
0.71mg
0.84mg
1%
Vitamin B6
0.066mg
0.058mg
1%
Vitamin K
2.4µg
1.8µg
1%
Calories
404kcal
406kcal
0%
Protein per 100 calories
5.7g
2g
N/A
Calories per 10 g protein
177kcal
495kcal
N/A
Weight per 100 calories
25g
25g
N/A
Unsaturated / Saturated Fat ratio
0.57
0.57
N/A
Vitamin C
0mg
0.2mg
0%
Net carbs
3.09g
43.2g
N/A
Sugar
0.48g
11.26g
N/A
Trans fat
0.917g
N/A
Tryptophan
0.547mg
0.099mg
0%
Threonine
1.044mg
0.284mg
0%
Isoleucine
1.206mg
0.365mg
0%
Leucine
1.939mg
0.623mg
0%
Lysine
1.025mg
0.329mg
0%
Methionine
0.547mg
0.175mg
0%
Phenylalanine
1.074mg
0.416mg
0%
Valine
1.404mg
0.41mg
0%
Histidine
0.547mg
0.187mg
0%
Omega-3 - EPA
0.01g
0.003g
N/A
Omega-3 - DHA
0.001g
0.002g
N/A
Omega-3 - DPA
0.017g
0g
N/A
Omega-6 - Eicosadienoic acid
0.007g
N/A
Macronutrient Comparison
Macronutrient breakdown side-by-side comparison
4
23%
33%
3%
37%
4%
Protein:
22.87 g
Fats:
33.31 g
Carbs:
3.09 g
Water:
37.02 g
Other:
3.71 g
1
8%
21%
46%
23%
2%
Protein:
8.2 g
Fats:
21 g
Carbs:
45.8 g
Water:
23.2 g
Other:
1.8 g
Contains
more
Protein Protein
+178.9%
Contains
more
Fats Fats
+58.6%
Contains
more
Water Water
+59.6%
Contains
more
Other Other
+106.1%
Contains
more
Carbs Carbs
+1382.2%
Fat Type Comparison
Fat type breakdown side-by-side comparison
2
64%
31%
5%
Saturated fat:
Sat. Fat
18.867 g
Monounsaturated fat:
Mono. Fat
9.246 g
Polyunsaturated fat:
Poly. Fat
1.421 g
1
64%
30%
6%
Saturated fat:
Sat. Fat
11.659 g
Monounsaturated fat:
Mono. Fat
5.525 g
Polyunsaturated fat:
Poly. Fat
1.094 g
Contains
more
Mono. Fat Monounsaturated fat
+67.3%
Contains
more
Poly. Fat Polyunsaturated fat
+29.9%
Contains
less
Sat. Fat Saturated fat
-38.2%