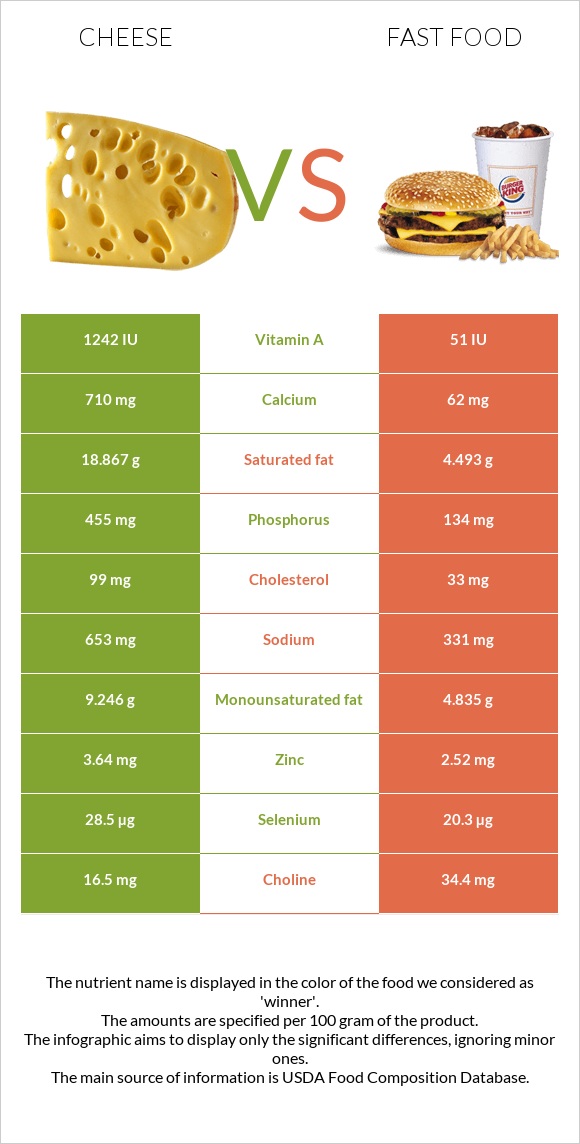
What are the main differences between cheese and fast food? Cheese is richer in calcium, phosphorus, vitamin A, and selenium, while fast food is higher in iron, vitamin B3, vitamin B1, and manganese. Cheese's daily need coverage for saturated fat is 72% higher. Fast food has 24 times less vitamin A than cheese. Cheese has 1242 IU of vitamin A, while fast food has 51 IU. Fast food is lower in saturated fat. Fast food has a higher glycemic index (66) than cheese (0). We used Cheese, cheddar and Fast foods, hamburger; single, regular patty; plain types in this comparison.
Infographic
Mineral Comparison
Mineral comparison score is based on the number of minerals by which one or the other food is richer. The "coverage" charts below show how much of the daily needs can be covered by 300 grams of the food.
4
100 g
300 g
1 cubic inch - 17g 1 slice (1 oz) - 28g 1 oz - 28.35g 1 cup, shredded - 113g 1 cup, diced - 132g 1 cup, melted - 244g
Magnesium
Magnesium
Calcium
Calcium
Potassium
Potassium
Iron
Iron
Copper
Copper
Zinc
Zinc
Phosphorus
Phosphorus
Sodium
Sodium
Manganese
Manganese
Selenium
Selenium
19%
213%
6.7%
5.3%
10%
99%
195%
85%
3.5%
155%
5
100 g
300 g
1 sandwich - 78g
Magnesium
Magnesium
Calcium
Calcium
Potassium
Potassium
Iron
Iron
Copper
Copper
Zinc
Zinc
Phosphorus
Phosphorus
Sodium
Sodium
Manganese
Manganese
Selenium
Selenium
19%
19%
17%
115%
40%
69%
57%
43%
47%
111%
Vitamin Comparison
Vitamin comparison score is based on the number of vitamins by which one or the other food is richer. The "coverage" charts below show how much of the daily needs can be covered by 300 grams of the food.
5
100 g
300 g
1 cubic inch - 17g 1 slice (1 oz) - 28g 1 oz - 28.35g 1 cup, shredded - 113g 1 cup, diced - 132g 1 cup, melted - 244g
Vitamin C
Vit. C
Vitamin D
Vit. D
Vitamin A
Vit. A
Vitamin E
Vit. E
Vitamin B1
Vit. B1
Vitamin B2
Vit. B2
Vitamin B3
Vit. B3
Vitamin B5
Vit. B5
Vitamin B6
Vit. B6
Vitamin B12
Vit. B12
Vitamin K
Vit. K
Folate
Folate
0%
9%
110%
14%
7.3%
99%
1.1%
25%
15%
138%
6%
20%
6
100 g
300 g
1 sandwich - 78g
Vitamin C
Vit. C
Vitamin D
Vit. D
Vitamin A
Vit. A
Vitamin E
Vit. E
Vitamin B1
Vit. B1
Vitamin B2
Vit. B2
Vitamin B3
Vit. B3
Vitamin B5
Vit. B5
Vitamin B6
Vit. B6
Vitamin B12
Vit. B12
Vitamin K
Vit. K
Folate
Folate
0%
1.5%
3%
7.6%
79%
84%
105%
32%
49%
111%
12%
60%
All nutrients comparison - raw data values
Nutrient
DV% diff.
Calcium
710mg
62mg
65%
Saturated fat
18.867g
4.493g
65%
Phosphorus
455mg
134mg
46%
Iron
0.14mg
3.06mg
37%
Vitamin A
330µg
9µg
36%
Vitamin B3
0.059mg
5.617mg
35%
Fats
33.31g
12.01g
33%
Vitamin B1
0.029mg
0.317mg
24%
Cholesterol
99mg
33mg
22%
Selenium
28.5µg
20.3µg
15%
Sodium
653mg
331mg
14%
Manganese
0.027mg
0.357mg
14%
Protein
22.87g
16.52g
13%
Folate
27µg
80µg
13%
Vitamin B6
0.066mg
0.212mg
11%
Monounsaturated fat
9.246g
4.835g
11%
Copper
0.03mg
0.121mg
10%
Zinc
3.64mg
2.52mg
10%
Carbs
3.09g
31.5g
9%
Starch
22.87g
9%
Vitamin B12
1.1µg
0.89µg
9%
Fiber
0g
1.7g
7%
Calories
404kcal
297kcal
5%
Vitamin B2
0.428mg
0.363mg
5%
Potassium
76mg
197mg
4%
Vitamin D*
24 IU
2 IU
3%
Vitamin D
0.6µg
0.1µg
3%
Choline
16.5mg
34.4mg
3%
Fructose
0g
2.27g
3%
Vitamin E
0.71mg
0.38mg
2%
Vitamin B5
0.41mg
0.53mg
2%
Vitamin K
2.4µg
4.9µg
2%
Polyunsaturated fat
1.421g
1.68g
2%
Protein per 100 calories
5.7g
5.6g
N/A
Calories per 10 g protein
177kcal
180kcal
N/A
Weight per 100 calories
25g
34g
N/A
Unsaturated / Saturated Fat ratio
0.57
1.5
N/A
Net carbs
3.09g
29.8g
N/A
Magnesium
27mg
27mg
0%
Sugar
0.48g
4.88g
N/A
Trans fat
0.917g
0.514g
N/A
Tryptophan
0.547mg
0.144mg
0%
Threonine
1.044mg
0.46mg
0%
Isoleucine
1.206mg
0.642mg
0%
Leucine
1.939mg
1.13mg
0%
Lysine
1.025mg
0.785mg
0%
Methionine
0.547mg
0.306mg
0%
Phenylalanine
1.074mg
0.67mg
0%
Valine
1.404mg
0.728mg
0%
Histidine
0.547mg
0.402mg
0%
Omega-3 - EPA
0.01g
0.005g
N/A
Omega-3 - DHA
0.001g
0.001g
N/A
Omega-3 - ALA
0.121g
N/A
Omega-3 - DPA
0.017g
0.009g
N/A
Omega-6 - Gamma-linoleic acid
0.004g
N/A
Omega-6 - Dihomo-gamma-linoleic acid
0.009g
N/A
Omega-6 - Eicosadienoic acid
0.007g
0.003g
N/A
Omega-6 - Linoleic acid
1.391g
N/A
Macronutrient Comparison
Macronutrient breakdown side-by-side comparison
3
23%
33%
3%
37%
4%
Protein:
22.87 g
Fats:
33.31 g
Carbs:
3.09 g
Water:
37.02 g
Other:
3.71 g
2
17%
12%
32%
38%
Protein:
16.52 g
Fats:
12.01 g
Carbs:
31.5 g
Water:
38.45 g
Other:
1.52 g
Contains
more
Protein Protein
+38.4%
Contains
more
Fats Fats
+177.4%
Contains
more
Other Other
+144.1%
Contains
more
Carbs Carbs
+919.4%
Fat Type Comparison
Fat type breakdown side-by-side comparison
1
64%
31%
5%
Saturated fat:
Sat. Fat
18.867 g
Monounsaturated fat:
Mono. Fat
9.246 g
Polyunsaturated fat:
Poly. Fat
1.421 g
2
41%
44%
15%
Saturated fat:
Sat. Fat
4.493 g
Monounsaturated fat:
Mono. Fat
4.835 g
Polyunsaturated fat:
Poly. Fat
1.68 g
Contains
more
Mono. Fat Monounsaturated fat
+91.2%
Contains
less
Sat. Fat Saturated fat
-76.2%
Contains
more
Poly. Fat Polyunsaturated fat
+18.2%
Carbohydrate type comparison
Carbohydrate type breakdown side-by-side comparison
2
54%
25%
21%
Starch:
0 g
Sucrose:
0 g
Glucose:
0.26 g
Fructose:
0 g
Lactose:
0.12 g
Maltose:
0 g
Galactose:
0.1 g
4
82%
7%
8%
2%
Starch:
22.87 g
Sucrose:
0 g
Glucose:
2.05 g
Fructose:
2.27 g
Lactose:
0 g
Maltose:
0.57 g
Galactose:
0 g
Contains
more
Lactose Lactose
+∞%
Contains
more
Galactose Galactose
+∞%
Contains
more
Starch Starch
+∞%
Contains
more
Glucose Glucose
+688.5%
Contains
more
Fructose Fructose
+∞%
Contains
more
Maltose Maltose
+∞%