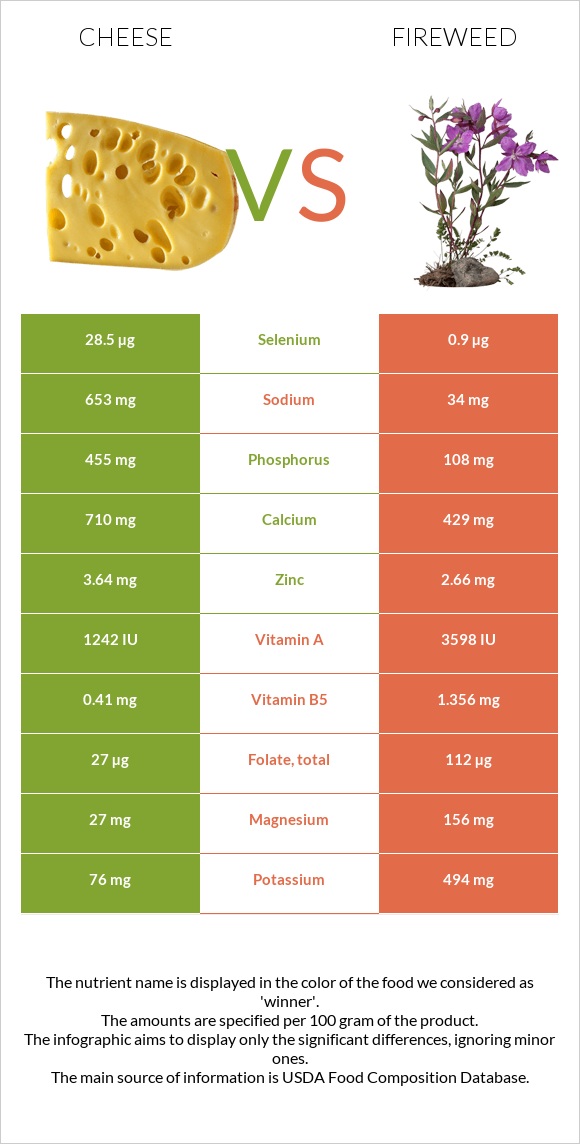
The main differences between cheese and fireweed Cheese is richer in selenium, phosphorus, and vitamin B12, yet fireweed is richer in manganese, vitamin A, vitamin B6, fiber, copper, and magnesium. Daily need coverage for manganese for fireweed is 290% higher. Fireweed contains less cholesterol. Food types used in this article are Cheese, cheddar and Fireweed, leaves, raw .
Infographic
Mineral Comparison
Mineral comparison score is based on the number of minerals by which one or the other food is richer. The "coverage" charts below show how much of the daily needs can be covered by 300 grams of the food.
4
100 g
300 g
1 cubic inch - 17g 1 slice (1 oz) - 28g 1 oz - 28.35g 1 cup, shredded - 113g 1 cup, diced - 132g 1 cup, melted - 244g
Magnesium
Magnesium
Calcium
Calcium
Potassium
Potassium
Iron
Iron
Copper
Copper
Zinc
Zinc
Phosphorus
Phosphorus
Sodium
Sodium
Manganese
Manganese
Selenium
Selenium
19%
213%
6.7%
5.3%
10%
99%
195%
85%
3.5%
155%
6
100 g
300 g
1 plant - 22g 1 cup, chopped - 23g
Magnesium
Magnesium
Calcium
Calcium
Potassium
Potassium
Iron
Iron
Copper
Copper
Zinc
Zinc
Phosphorus
Phosphorus
Sodium
Sodium
Manganese
Manganese
Selenium
Selenium
111%
129%
44%
90%
107%
73%
46%
4.4%
874%
4.9%
Vitamin Comparison
Vitamin comparison score is based on the number of vitamins by which one or the other food is richer. The "coverage" charts below show how much of the daily needs can be covered by 300 grams of the food.
6
100 g
300 g
1 cubic inch - 17g 1 slice (1 oz) - 28g 1 oz - 28.35g 1 cup, shredded - 113g 1 cup, diced - 132g 1 cup, melted - 244g
Vitamin C
Vit. C
Vitamin D
Vit. D
Vitamin A
Vit. A
Vitamin E
Vit. E
Vitamin B1
Vit. B1
Vitamin B2
Vit. B2
Vitamin B3
Vit. B3
Vitamin B5
Vit. B5
Vitamin B6
Vit. B6
Vitamin B12
Vit. B12
Vitamin K
Vit. K
Folate
Folate
0%
9%
110%
14%
7.3%
99%
1.1%
25%
15%
138%
6%
20%
6
100 g
300 g
1 plant - 22g 1 cup, chopped - 23g
Vitamin C
Vit. C
Vitamin D
Vit. D
Vitamin A
Vit. A
Vitamin E
Vit. E
Vitamin B1
Vit. B1
Vitamin B2
Vit. B2
Vitamin B3
Vit. B3
Vitamin B5
Vit. B5
Vitamin B6
Vit. B6
Vitamin B12
Vit. B12
Vitamin K
Vit. K
Folate
Folate
7.3%
0%
60%
0%
8.3%
32%
88%
81%
146%
0%
0%
84%
All nutrients comparison - raw data values
Nutrient
DV% diff.
Manganese
0.027mg
6.704mg
290%
Saturated fat
18.867g
86%
Phosphorus
455mg
108mg
50%
Selenium
28.5µg
0.9µg
50%
Fats
33.31g
2.75g
47%
Vitamin B12
1.1µg
0µg
46%
Vitamin B6
0.066mg
0.632mg
44%
Fiber
0g
10.6g
42%
Protein
22.87g
4.71g
36%
Cholesterol
99mg
0mg
33%
Copper
0.03mg
0.32mg
32%
Magnesium
27mg
156mg
31%
Vitamin B3
0.059mg
4.674mg
29%
Calcium
710mg
429mg
28%
Iron
0.14mg
2.4mg
28%
Sodium
653mg
34mg
27%
Monounsaturated fat
9.246g
23%
Vitamin B2
0.428mg
0.137mg
22%
Folate
27µg
112µg
21%
Vitamin B5
0.41mg
1.356mg
19%
Vitamin A
330µg
180µg
17%
Calories
404kcal
103kcal
15%
Potassium
76mg
494mg
12%
Zinc
3.64mg
2.66mg
9%
Polyunsaturated fat
1.421g
9%
Carbs
3.09g
19.22g
5%
Vitamin E
0.71mg
5%
Vitamin D*
24 IU
0 IU
3%
Vitamin D
0.6µg
0µg
3%
Choline
16.5mg
3%
Vitamin C
0mg
2.2mg
2%
Vitamin K
2.4µg
2%
Protein per 100 calories
5.7g
4.6g
N/A
Calories per 10 g protein
177kcal
219kcal
N/A
Weight per 100 calories
25g
97g
N/A
Unsaturated / Saturated Fat ratio
0.57
N/A
Net carbs
3.09g
8.62g
N/A
Sugar
0.48g
N/A
Vitamin B1
0.029mg
0.033mg
0%
Trans fat
0.917g
0g
N/A
Tryptophan
0.547mg
0%
Threonine
1.044mg
0%
Isoleucine
1.206mg
0%
Leucine
1.939mg
0%
Lysine
1.025mg
0%
Methionine
0.547mg
0%
Phenylalanine
1.074mg
0%
Valine
1.404mg
0%
Histidine
0.547mg
0%
Omega-3 - EPA
0.01g
N/A
Omega-3 - DHA
0.001g
N/A
Omega-3 - DPA
0.017g
N/A
Omega-6 - Eicosadienoic acid
0.007g
N/A
Macronutrient Comparison
Macronutrient breakdown side-by-side comparison
3
23%
33%
3%
37%
4%
Protein:
22.87 g
Fats:
33.31 g
Carbs:
3.09 g
Water:
37.02 g
Other:
3.71 g
2
5%
3%
19%
71%
3%
Protein:
4.71 g
Fats:
2.75 g
Carbs:
19.22 g
Water:
70.78 g
Other:
2.54 g
Contains
more
Protein Protein
+385.6%
Contains
more
Fats Fats
+1111.3%
Contains
more
Other Other
+46.1%
Contains
more
Carbs Carbs
+522%
Contains
more
Water Water
+91.2%