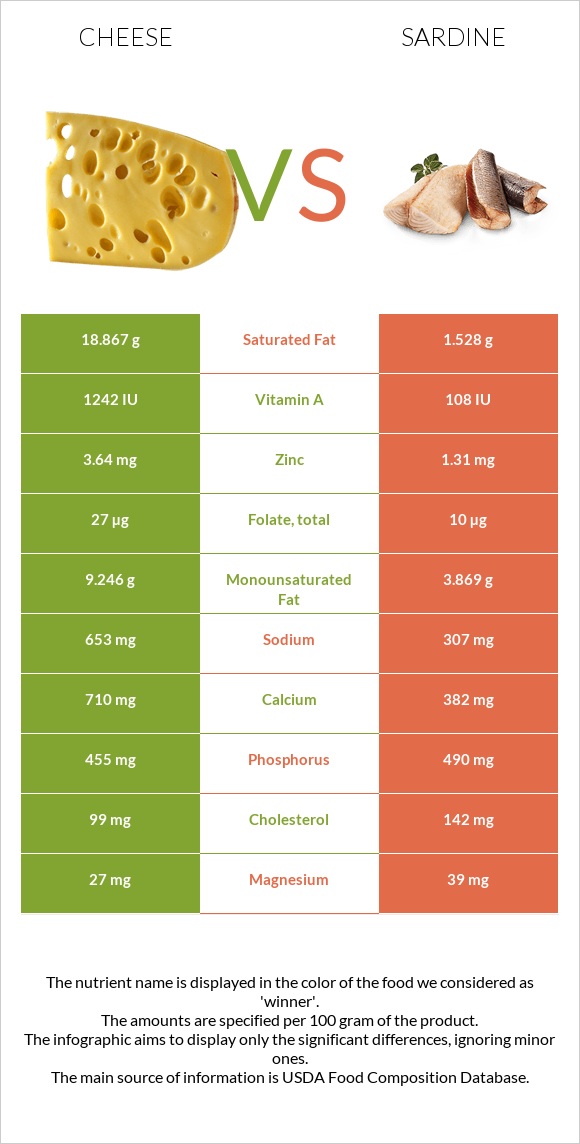
What are the differences between cheese and sardines? Cheese is higher in calcium, vitamin A, and zinc; however, sardines are richer in vitamin B12, selenium, iron, vitamin B3, vitamin D* and copper. Sardines' daily need coverage for vitamin B12 is 327% more. Sardines contain 12 times less saturated fat than cheese. Cheese contains 18.867g of saturated fat, while sardines contain 1.528g. We used Cheese, cheddar and Fish, sardine, Atlantic, canned in oil, drained solids with bone types in this article.
Infographic
Mineral Comparison
Mineral comparison score is based on the number of minerals by which one or the other food is richer. The "coverage" charts below show how much of the daily needs can be covered by 300 grams of the food.
2
100 g
300 g
1 cubic inch - 17g 1 slice (1 oz) - 28g 1 oz - 28.35g 1 cup, shredded - 113g 1 cup, diced - 132g 1 cup, melted - 244g
Magnesium
Magnesium
Calcium
Calcium
Potassium
Potassium
Iron
Iron
Copper
Copper
Zinc
Zinc
Phosphorus
Phosphorus
Sodium
Sodium
Manganese
Manganese
Selenium
Selenium
19%
213%
6.7%
5.3%
10%
99%
195%
85%
3.5%
155%
7
100 g
300 g
1 small (2-2/3" x 1/2" x 1/4") - 12g 1 cubic inch - 16g 2 sardines - 24g 1 oz - 28.35g 1 can (3.75 oz) - 92g 1 cup, drained - 149g
Magnesium
Magnesium
Calcium
Calcium
Potassium
Potassium
Iron
Iron
Copper
Copper
Zinc
Zinc
Phosphorus
Phosphorus
Sodium
Sodium
Manganese
Manganese
Selenium
Selenium
28%
115%
35%
110%
62%
36%
210%
40%
14%
287%
Vitamin Comparison
Vitamin comparison score is based on the number of vitamins by which one or the other food is richer. The "coverage" charts below show how much of the daily needs can be covered by 300 grams of the food.
3
100 g
300 g
1 cubic inch - 17g 1 slice (1 oz) - 28g 1 oz - 28.35g 1 cup, shredded - 113g 1 cup, diced - 132g 1 cup, melted - 244g
Vitamin C
Vit. C
Vitamin D
Vit. D
Vitamin A
Vit. A
Vitamin E
Vit. E
Vitamin B1
Vit. B1
Vitamin B2
Vit. B2
Vitamin B3
Vit. B3
Vitamin B5
Vit. B5
Vitamin B6
Vit. B6
Vitamin B12
Vit. B12
Vitamin K
Vit. K
Folate
Folate
0%
9%
110%
14%
7.3%
99%
1.1%
25%
15%
138%
6%
20%
7
100 g
300 g
1 small (2-2/3" x 1/2" x 1/4") - 12g 1 cubic inch - 16g 2 sardines - 24g 1 oz - 28.35g 1 can (3.75 oz) - 92g 1 cup, drained - 149g
Vitamin C
Vit. C
Vitamin D
Vit. D
Vitamin A
Vit. A
Vitamin E
Vit. E
Vitamin B1
Vit. B1
Vitamin B2
Vit. B2
Vitamin B3
Vit. B3
Vitamin B5
Vit. B5
Vitamin B6
Vit. B6
Vitamin B12
Vit. B12
Vitamin K
Vit. K
Folate
Folate
0%
72%
11%
41%
20%
52%
98%
39%
39%
1118%
6.5%
7.5%
All nutrients comparison - raw data values
Nutrient
DV% diff.
Vitamin B12
1.1µg
8.94µg
327%
Saturated fat
18.867g
1.528g
79%
Selenium
28.5µg
52.7µg
44%
Iron
0.14mg
2.92mg
35%
Fats
33.31g
11.45g
34%
Calcium
710mg
382mg
33%
Vitamin A
330µg
32µg
33%
Vitamin B3
0.059mg
5.245mg
32%
Polyunsaturated fat
1.421g
5.148g
25%
Vitamin D*
24 IU
193 IU
21%
Vitamin D
0.6µg
4.8µg
21%
Zinc
3.64mg
1.31mg
21%
Copper
0.03mg
0.186mg
17%
Sodium
653mg
307mg
15%
Vitamin B2
0.428mg
0.227mg
15%
Cholesterol
99mg
142mg
14%
Monounsaturated fat
9.246g
3.869g
13%
Choline
16.5mg
75mg
11%
Calories
404kcal
208kcal
10%
Potassium
76mg
397mg
9%
Vitamin E
0.71mg
2.04mg
9%
Vitamin B6
0.066mg
0.167mg
8%
Phosphorus
455mg
490mg
5%
Vitamin B5
0.41mg
0.642mg
5%
Protein
22.87g
24.62g
4%
Manganese
0.027mg
0.108mg
4%
Vitamin B1
0.029mg
0.08mg
4%
Folate
27µg
10µg
4%
Magnesium
27mg
39mg
3%
Carbs
3.09g
0g
1%
Protein per 100 calories
5.7g
12g
N/A
Calories per 10 g protein
177kcal
84kcal
N/A
Weight per 100 calories
25g
48g
N/A
Unsaturated / Saturated Fat ratio
0.57
5.9
N/A
Net carbs
3.09g
0g
N/A
Sugar
0.48g
0g
N/A
Vitamin K
2.4µg
2.6µg
0%
Trans fat
0.917g
N/A
Tryptophan
0.547mg
0.276mg
0%
Threonine
1.044mg
1.079mg
0%
Isoleucine
1.206mg
1.134mg
0%
Leucine
1.939mg
2.001mg
0%
Lysine
1.025mg
2.26mg
0%
Methionine
0.547mg
0.729mg
0%
Phenylalanine
1.074mg
0.961mg
0%
Valine
1.404mg
1.268mg
0%
Histidine
0.547mg
0.725mg
0%
Omega-3 - EPA
0.01g
0.473g
N/A
Omega-3 - DHA
0.001g
0.509g
N/A
Omega-3 - DPA
0.017g
0g
N/A
Omega-6 - Eicosadienoic acid
0.007g
N/A
Macronutrient Comparison
Macronutrient breakdown side-by-side comparison
2
23%
33%
3%
37%
4%
Protein:
22.87 g
Fats:
33.31 g
Carbs:
3.09 g
Water:
37.02 g
Other:
3.71 g
3
25%
11%
60%
4%
Protein:
24.62 g
Fats:
11.45 g
Carbs:
0 g
Water:
59.61 g
Other:
4.32 g
Contains
more
Fats Fats
+190.9%
Contains
more
Carbs Carbs
+∞%
Contains
more
Water Water
+61%
Contains
more
Other Other
+16.4%
~equal in
Protein
~24.62g
Fat Type Comparison
Fat type breakdown side-by-side comparison
1
64%
31%
5%
Saturated fat:
Sat. Fat
18.867 g
Monounsaturated fat:
Mono. Fat
9.246 g
Polyunsaturated fat:
Poly. Fat
1.421 g
2
14%
37%
49%
Saturated fat:
Sat. Fat
1.528 g
Monounsaturated fat:
Mono. Fat
3.869 g
Polyunsaturated fat:
Poly. Fat
5.148 g
Contains
more
Mono. Fat Monounsaturated fat
+139%
Contains
less
Sat. Fat Saturated fat
-91.9%
Contains
more
Poly. Fat Polyunsaturated fat
+262.3%