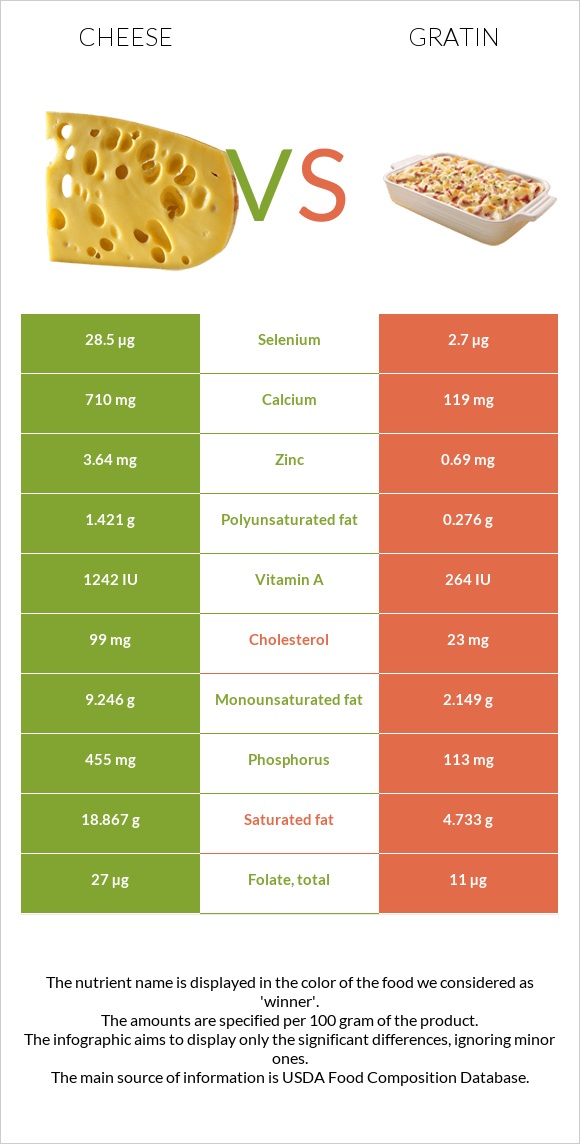
Important differences between cheese and gratin Cheese has more calcium, phosphorus, selenium, vitamin B12, zinc, vitamin B2, and vitamin A; however, gratin has more copper. Cheese's daily need coverage for saturated fat is 71% more. Gratin is lower in cholesterol. The food varieties used in the comparison are Cheese, cheddar and Potatoes, au gratin, home-prepared from recipe using butter .
Infographic
Mineral Comparison
Mineral comparison score is based on the number of minerals by which one or the other food is richer. The "coverage" charts below show how much of the daily needs can be covered by 300 grams of the food.
5
100 g
300 g
1 cubic inch - 17g 1 slice (1 oz) - 28g 1 oz - 28.35g 1 cup, shredded - 113g 1 cup, diced - 132g 1 cup, melted - 244g
Magnesium
Magnesium
Calcium
Calcium
Potassium
Potassium
Iron
Iron
Copper
Copper
Zinc
Zinc
Phosphorus
Phosphorus
Sodium
Sodium
Manganese
Manganese
Selenium
Selenium
19%
213%
6.7%
5.3%
10%
99%
195%
85%
3.5%
155%
5
100 g
300 g
1 cup - 245g
Magnesium
Magnesium
Calcium
Calcium
Potassium
Potassium
Iron
Iron
Copper
Copper
Zinc
Zinc
Phosphorus
Phosphorus
Sodium
Sodium
Manganese
Manganese
Selenium
Selenium
14%
36%
35%
24%
53%
19%
48%
56%
21%
15%
Vitamin Comparison
Vitamin comparison score is based on the number of vitamins by which one or the other food is richer. The "coverage" charts below show how much of the daily needs can be covered by 300 grams of the food.
7
100 g
300 g
1 cubic inch - 17g 1 slice (1 oz) - 28g 1 oz - 28.35g 1 cup, shredded - 113g 1 cup, diced - 132g 1 cup, melted - 244g
Vitamin C
Vit. C
Vitamin D
Vit. D
Vitamin A
Vit. A
Vitamin E
Vit. E
Vitamin B1
Vit. B1
Vitamin B2
Vit. B2
Vitamin B3
Vit. B3
Vitamin B5
Vit. B5
Vitamin B6
Vit. B6
Vitamin B12
Vit. B12
Vitamin K
Vit. K
Folate
Folate
0%
9%
110%
14%
7.3%
99%
1.1%
25%
15%
138%
6%
20%
4
100 g
300 g
1 cup - 245g
Vitamin C
Vit. C
Vitamin D
Vit. D
Vitamin A
Vit. A
Vitamin E
Vit. E
Vitamin B1
Vit. B1
Vitamin B2
Vit. B2
Vitamin B3
Vit. B3
Vitamin B5
Vit. B5
Vitamin B6
Vit. B6
Vitamin B12
Vit. B12
Vitamin K
Vit. K
Folate
Folate
33%
0%
21%
0%
16%
27%
19%
23%
40%
0%
0%
8.3%
All nutrients comparison - raw data values
Nutrient
DV% diff.
Saturated fat
18.867g
4.733g
64%
Calcium
710mg
119mg
59%
Phosphorus
455mg
113mg
49%
Selenium
28.5µg
2.7µg
47%
Vitamin B12
1.1µg
0µg
46%
Fats
33.31g
7.59g
40%
Protein
22.87g
5.06g
36%
Vitamin A
330µg
64µg
30%
Zinc
3.64mg
0.69mg
27%
Cholesterol
99mg
23mg
25%
Vitamin B2
0.428mg
0.116mg
24%
Monounsaturated fat
9.246g
2.149g
18%
Calories
404kcal
132kcal
14%
Copper
0.03mg
0.16mg
14%
Vitamin C
0mg
9.9mg
11%
Sodium
653mg
433mg
10%
Potassium
76mg
396mg
9%
Vitamin B6
0.066mg
0.174mg
8%
Polyunsaturated fat
1.421g
0.276g
8%
Fiber
0g
1.8g
7%
Iron
0.14mg
0.64mg
6%
Manganese
0.027mg
0.161mg
6%
Vitamin B3
0.059mg
0.993mg
6%
Vitamin E
0.71mg
5%
Folate
27µg
11µg
4%
Carbs
3.09g
11.27g
3%
Vitamin D*
24 IU
0 IU
3%
Vitamin D
0.6µg
0µg
3%
Vitamin B1
0.029mg
0.064mg
3%
Choline
16.5mg
3%
Magnesium
27mg
20mg
2%
Vitamin K
2.4µg
2%
Protein per 100 calories
5.7g
3.8g
N/A
Calories per 10 g protein
177kcal
261kcal
N/A
Weight per 100 calories
25g
76g
N/A
Unsaturated / Saturated Fat ratio
0.57
0.51
N/A
Net carbs
3.09g
9.47g
N/A
Sugar
0.48g
N/A
Vitamin B5
0.41mg
0.387mg
0%
Trans fat
0.917g
N/A
Tryptophan
0.547mg
0.07mg
0%
Threonine
1.044mg
0.192mg
0%
Isoleucine
1.206mg
0.284mg
0%
Leucine
1.939mg
0.443mg
0%
Lysine
1.025mg
0.381mg
0%
Methionine
0.547mg
0.117mg
0%
Phenylalanine
1.074mg
0.254mg
0%
Valine
1.404mg
0.325mg
0%
Histidine
0.547mg
0.151mg
0%
Omega-3 - EPA
0.01g
N/A
Omega-3 - DHA
0.001g
N/A
Omega-3 - DPA
0.017g
N/A
Omega-6 - Eicosadienoic acid
0.007g
N/A
Macronutrient Comparison
Macronutrient breakdown side-by-side comparison
3
23%
33%
3%
37%
4%
Protein:
22.87 g
Fats:
33.31 g
Carbs:
3.09 g
Water:
37.02 g
Other:
3.71 g
2
5%
8%
11%
74%
2%
Protein:
5.06 g
Fats:
7.59 g
Carbs:
11.27 g
Water:
74 g
Other:
2.08 g
Contains
more
Protein Protein
+352%
Contains
more
Fats Fats
+338.9%
Contains
more
Other Other
+78.4%
Contains
more
Carbs Carbs
+264.7%
Contains
more
Water Water
+99.9%
Fat Type Comparison
Fat type breakdown side-by-side comparison
2
64%
31%
5%
Saturated fat:
Sat. Fat
18.867 g
Monounsaturated fat:
Mono. Fat
9.246 g
Polyunsaturated fat:
Poly. Fat
1.421 g
1
66%
30%
4%
Saturated fat:
Sat. Fat
4.733 g
Monounsaturated fat:
Mono. Fat
2.149 g
Polyunsaturated fat:
Poly. Fat
0.276 g
Contains
more
Mono. Fat Monounsaturated fat
+330.2%
Contains
more
Poly. Fat Polyunsaturated fat
+414.9%
Contains
less
Sat. Fat Saturated fat
-74.9%