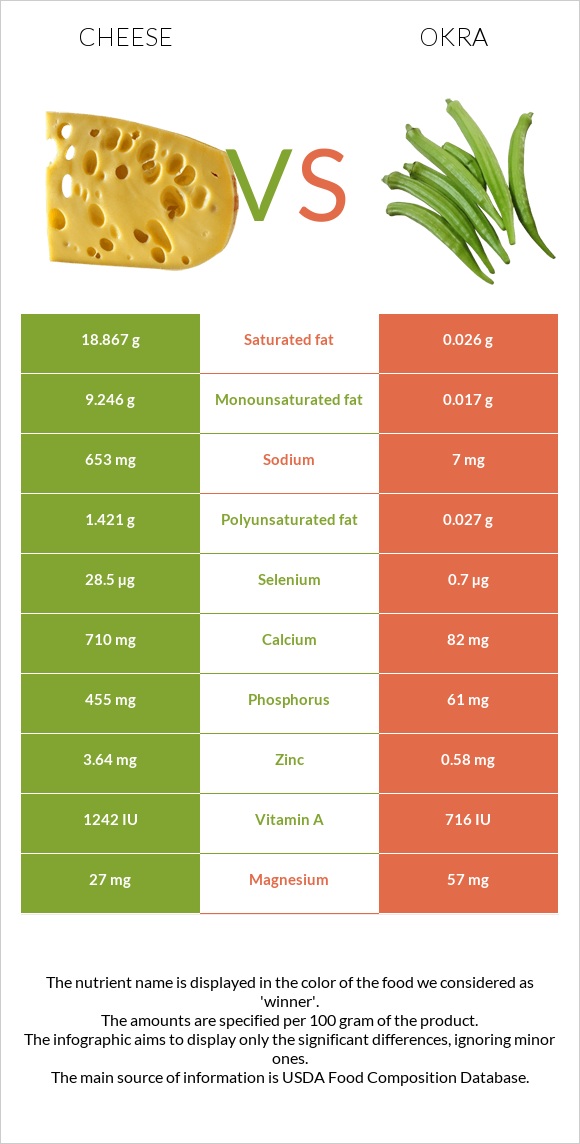
What are the differences between cheese and okra? Cheese is higher in calcium, phosphorus, selenium, vitamin B12, vitamin B2, and zinc; however, okra is richer in manganese. Cheese's daily need coverage for saturated fat is 94% more. Okra has less cholesterol. We used Cheese, cheddar and Okra, raw types in this article.
Infographic
Mineral Comparison
Mineral comparison score is based on the number of minerals by which one or the other food is richer. The "coverage" charts below show how much of the daily needs can be covered by 300 grams of the food.
4
100 g
300 g
1 cubic inch - 17g 1 slice (1 oz) - 28g 1 oz - 28.35g 1 cup, shredded - 113g 1 cup, diced - 132g 1 cup, melted - 244g
Magnesium
Magnesium
Calcium
Calcium
Potassium
Potassium
Iron
Iron
Copper
Copper
Zinc
Zinc
Phosphorus
Phosphorus
Sodium
Sodium
Manganese
Manganese
Selenium
Selenium
19%
213%
6.7%
5.3%
10%
99%
195%
85%
3.5%
155%
6
100 g
300 g
8 pods (3" long) - 95g
Magnesium
Magnesium
Calcium
Calcium
Potassium
Potassium
Iron
Iron
Copper
Copper
Zinc
Zinc
Phosphorus
Phosphorus
Sodium
Sodium
Manganese
Manganese
Selenium
Selenium
41%
25%
26%
23%
36%
16%
26%
0.91%
103%
3.8%
Vitamin Comparison
Vitamin comparison score is based on the number of vitamins by which one or the other food is richer. The "coverage" charts below show how much of the daily needs can be covered by 300 grams of the food.
6
100 g
300 g
1 cubic inch - 17g 1 slice (1 oz) - 28g 1 oz - 28.35g 1 cup, shredded - 113g 1 cup, diced - 132g 1 cup, melted - 244g
Vitamin C
Vit. C
Vitamin D
Vit. D
Vitamin A
Vit. A
Vitamin E
Vit. E
Vitamin B1
Vit. B1
Vitamin B2
Vit. B2
Vitamin B3
Vit. B3
Vitamin B5
Vit. B5
Vitamin B6
Vit. B6
Vitamin B12
Vit. B12
Vitamin K
Vit. K
Folate
Folate
0%
9%
110%
14%
7.3%
99%
1.1%
25%
15%
138%
6%
20%
6
100 g
300 g
8 pods (3" long) - 95g
Vitamin C
Vit. C
Vitamin D
Vit. D
Vitamin A
Vit. A
Vitamin E
Vit. E
Vitamin B1
Vit. B1
Vitamin B2
Vit. B2
Vitamin B3
Vit. B3
Vitamin B5
Vit. B5
Vitamin B6
Vit. B6
Vitamin B12
Vit. B12
Vitamin K
Vit. K
Folate
Folate
77%
0%
12%
5.4%
50%
14%
19%
15%
50%
0%
78%
45%
All nutrients comparison - raw data values
Nutrient
DV% diff.
Saturated fat
18.867g
0.026g
86%
Calcium
710mg
82mg
63%
Phosphorus
455mg
61mg
56%
Fats
33.31g
0.19g
51%
Selenium
28.5µg
0.7µg
51%
Vitamin B12
1.1µg
0µg
46%
Protein
22.87g
1.93g
42%
Cholesterol
99mg
0mg
33%
Vitamin A
330µg
36µg
33%
Manganese
0.027mg
0.788mg
33%
Zinc
3.64mg
0.58mg
28%
Sodium
653mg
7mg
28%
Vitamin B2
0.428mg
0.06mg
28%
Vitamin C
0mg
23mg
26%
Vitamin K
2.4µg
31.3µg
24%
Monounsaturated fat
9.246g
0.017g
23%
Calories
404kcal
33kcal
19%
Vitamin B1
0.029mg
0.2mg
14%
Fiber
0g
3.2g
13%
Vitamin B6
0.066mg
0.215mg
11%
Copper
0.03mg
0.109mg
9%
Polyunsaturated fat
1.421g
0.027g
9%
Folate
27µg
60µg
8%
Magnesium
27mg
57mg
7%
Potassium
76mg
299mg
7%
Iron
0.14mg
0.62mg
6%
Vitamin B3
0.059mg
1mg
6%
Vitamin D*
24 IU
0 IU
3%
Vitamin D
0.6µg
0µg
3%
Vitamin E
0.71mg
0.27mg
3%
Vitamin B5
0.41mg
0.245mg
3%
Carbs
3.09g
7.45g
1%
Choline
16.5mg
12.3mg
1%
Fructose
0g
0.57g
1%
Protein per 100 calories
5.7g
5.8g
N/A
Calories per 10 g protein
177kcal
171kcal
N/A
Weight per 100 calories
25g
303g
N/A
Unsaturated / Saturated Fat ratio
0.57
1.7
N/A
Net carbs
3.09g
4.25g
N/A
Sugar
0.48g
1.48g
N/A
Starch
0.34g
0%
Trans fat
0.917g
0g
N/A
Tryptophan
0.547mg
0.017mg
0%
Threonine
1.044mg
0.065mg
0%
Isoleucine
1.206mg
0.069mg
0%
Leucine
1.939mg
0.105mg
0%
Lysine
1.025mg
0.081mg
0%
Methionine
0.547mg
0.021mg
0%
Phenylalanine
1.074mg
0.065mg
0%
Valine
1.404mg
0.091mg
0%
Histidine
0.547mg
0.031mg
0%
Omega-3 - EPA
0.01g
0g
N/A
Omega-3 - DHA
0.001g
0g
N/A
Omega-3 - DPA
0.017g
0g
N/A
Omega-6 - Eicosadienoic acid
0.007g
N/A
Macronutrient Comparison
Macronutrient breakdown side-by-side comparison
3
23%
33%
3%
37%
4%
Protein:
22.87 g
Fats:
33.31 g
Carbs:
3.09 g
Water:
37.02 g
Other:
3.71 g
2
2%
7%
90%
Protein:
1.93 g
Fats:
0.19 g
Carbs:
7.45 g
Water:
89.58 g
Other:
0.85 g
Contains
more
Protein Protein
+1085%
Contains
more
Fats Fats
+17431.6%
Contains
more
Other Other
+336.5%
Contains
more
Carbs Carbs
+141.1%
Contains
more
Water Water
+142%
Fat Type Comparison
Fat type breakdown side-by-side comparison
2
64%
31%
5%
Saturated fat:
Sat. Fat
18.867 g
Monounsaturated fat:
Mono. Fat
9.246 g
Polyunsaturated fat:
Poly. Fat
1.421 g
1
37%
24%
39%
Saturated fat:
Sat. Fat
0.026 g
Monounsaturated fat:
Mono. Fat
0.017 g
Polyunsaturated fat:
Poly. Fat
0.027 g
Contains
more
Mono. Fat Monounsaturated fat
+54288.2%
Contains
more
Poly. Fat Polyunsaturated fat
+5163%
Contains
less
Sat. Fat Saturated fat
-99.9%
Carbohydrate type comparison
Carbohydrate type breakdown side-by-side comparison
2
54%
25%
21%
Starch:
0 g
Sucrose:
0 g
Glucose:
0.26 g
Fructose:
0 g
Lactose:
0.12 g
Maltose:
0 g
Galactose:
0.1 g
4
19%
33%
17%
31%
Starch:
0.34 g
Sucrose:
0.6 g
Glucose:
0.32 g
Fructose:
0.57 g
Lactose:
0 g
Maltose:
0 g
Galactose:
0 g
Contains
more
Lactose Lactose
+∞%
Contains
more
Galactose Galactose
+∞%
Contains
more
Starch Starch
+∞%
Contains
more
Sucrose Sucrose
+∞%
Contains
more
Glucose Glucose
+23.1%
Contains
more
Fructose Fructose
+∞%