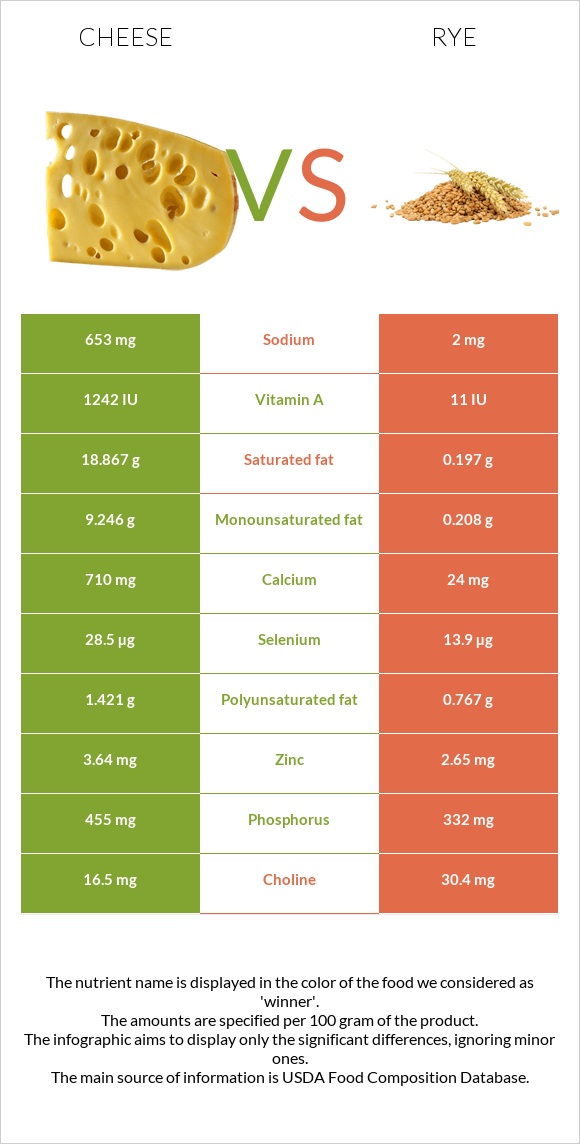
Differences between cheese and rye Cheese has more calcium, vitamin B12, and selenium, while rye has more manganese, fiber, copper, and iron. Rye's daily need coverage for manganese is 111% higher. The amount of cholesterol in rye is lower. Cheese has a lower glycemic index. The glycemic index of cheese is 0, while the glycemic index of rye is 34. The food types used in this comparison are Cheese, cheddar and Rye grain .
Infographic
Mineral Comparison
Mineral comparison score is based on the number of minerals by which one or the other food is richer. The "coverage" charts below show how much of the daily needs can be covered by 300 grams of the food.
4
100 g
300 g
1 cubic inch - 17g 1 slice (1 oz) - 28g 1 oz - 28.35g 1 cup, shredded - 113g 1 cup, diced - 132g 1 cup, melted - 244g
Magnesium
Magnesium
Calcium
Calcium
Potassium
Potassium
Iron
Iron
Copper
Copper
Zinc
Zinc
Phosphorus
Phosphorus
Sodium
Sodium
Manganese
Manganese
Selenium
Selenium
19%
213%
6.7%
5.3%
10%
99%
195%
85%
3.5%
155%
6
100 g
300 g
1 cup - 169g
Magnesium
Magnesium
Calcium
Calcium
Potassium
Potassium
Iron
Iron
Copper
Copper
Zinc
Zinc
Phosphorus
Phosphorus
Sodium
Sodium
Manganese
Manganese
Selenium
Selenium
79%
7.2%
45%
99%
122%
72%
142%
0.26%
336%
76%
Vitamin Comparison
Vitamin comparison score is based on the number of vitamins by which one or the other food is richer. The "coverage" charts below show how much of the daily needs can be covered by 300 grams of the food.
4
100 g
300 g
1 cubic inch - 17g 1 slice (1 oz) - 28g 1 oz - 28.35g 1 cup, shredded - 113g 1 cup, diced - 132g 1 cup, melted - 244g
Vitamin C
Vit. C
Vitamin D
Vit. D
Vitamin A
Vit. A
Vitamin E
Vit. E
Vitamin B1
Vit. B1
Vitamin B2
Vit. B2
Vitamin B3
Vit. B3
Vitamin B5
Vit. B5
Vitamin B6
Vit. B6
Vitamin B12
Vit. B12
Vitamin K
Vit. K
Folate
Folate
0%
9%
110%
14%
7.3%
99%
1.1%
25%
15%
138%
6%
20%
7
100 g
300 g
1 cup - 169g
Vitamin C
Vit. C
Vitamin D
Vit. D
Vitamin A
Vit. A
Vitamin E
Vit. E
Vitamin B1
Vit. B1
Vitamin B2
Vit. B2
Vitamin B3
Vit. B3
Vitamin B5
Vit. B5
Vitamin B6
Vit. B6
Vitamin B12
Vit. B12
Vitamin K
Vit. K
Folate
Folate
0%
0%
0.33%
17%
79%
58%
80%
87%
68%
0%
15%
29%
All nutrients comparison - raw data values
Nutrient
DV% diff.
Manganese
0.027mg
2.577mg
111%
Saturated fat
18.867g
0.197g
85%
Calcium
710mg
24mg
69%
Fiber
0g
15.1g
60%
Fats
33.31g
1.63g
49%
Vitamin B12
1.1µg
0µg
46%
Copper
0.03mg
0.367mg
37%
Vitamin A
330µg
1µg
37%
Cholesterol
99mg
0mg
33%
Iron
0.14mg
2.63mg
31%
Sodium
653mg
2mg
28%
Selenium
28.5µg
13.9µg
27%
Vitamin B3
0.059mg
4.27mg
26%
Protein
22.87g
10.34g
25%
Carbs
3.09g
75.86g
24%
Vitamin B1
0.029mg
0.316mg
24%
Monounsaturated fat
9.246g
0.208g
23%
Vitamin B5
0.41mg
1.456mg
21%
Magnesium
27mg
110mg
20%
Phosphorus
455mg
332mg
18%
Vitamin B6
0.066mg
0.294mg
18%
Vitamin B2
0.428mg
0.251mg
14%
Potassium
76mg
510mg
13%
Zinc
3.64mg
2.65mg
9%
Polyunsaturated fat
1.421g
0.767g
4%
Calories
404kcal
338kcal
3%
Vitamin D*
24 IU
0 IU
3%
Vitamin D
0.6µg
0µg
3%
Vitamin K
2.4µg
5.9µg
3%
Folate
27µg
38µg
3%
Choline
16.5mg
30.4mg
3%
Vitamin E
0.71mg
0.85mg
1%
Protein per 100 calories
5.7g
3.1g
N/A
Calories per 10 g protein
177kcal
327kcal
N/A
Weight per 100 calories
25g
30g
N/A
Unsaturated / Saturated Fat ratio
0.57
4.9
N/A
Net carbs
3.09g
60.76g
N/A
Sugar
0.48g
0.98g
N/A
Trans fat
0.917g
0g
N/A
Tryptophan
0.547mg
0.108mg
0%
Threonine
1.044mg
0.289mg
0%
Isoleucine
1.206mg
0.208mg
0%
Leucine
1.939mg
0.563mg
0%
Lysine
1.025mg
0.286mg
0%
Methionine
0.547mg
0.153mg
0%
Phenylalanine
1.074mg
0.435mg
0%
Valine
1.404mg
0.317mg
0%
Histidine
0.547mg
0.189mg
0%
Fructose
0g
0.11g
0%
Omega-3 - EPA
0.01g
0g
N/A
Omega-3 - DHA
0.001g
0g
N/A
Omega-3 - DPA
0.017g
0g
N/A
Omega-6 - Eicosadienoic acid
0.007g
N/A
Macronutrient Comparison
Macronutrient breakdown side-by-side comparison
4
23%
33%
3%
37%
4%
Protein:
22.87 g
Fats:
33.31 g
Carbs:
3.09 g
Water:
37.02 g
Other:
3.71 g
1
10%
76%
11%
Protein:
10.34 g
Fats:
1.63 g
Carbs:
75.86 g
Water:
10.6 g
Other:
1.57 g
Contains
more
Protein Protein
+121.2%
Contains
more
Fats Fats
+1943.6%
Contains
more
Water Water
+249.2%
Contains
more
Other Other
+136.3%
Contains
more
Carbs Carbs
+2355%
Fat Type Comparison
Fat type breakdown side-by-side comparison
2
64%
31%
5%
Saturated fat:
Sat. Fat
18.867 g
Monounsaturated fat:
Mono. Fat
9.246 g
Polyunsaturated fat:
Poly. Fat
1.421 g
1
17%
18%
65%
Saturated fat:
Sat. Fat
0.197 g
Monounsaturated fat:
Mono. Fat
0.208 g
Polyunsaturated fat:
Poly. Fat
0.767 g
Contains
more
Mono. Fat Monounsaturated fat
+4345.2%
Contains
more
Poly. Fat Polyunsaturated fat
+85.3%
Contains
less
Sat. Fat Saturated fat
-99%
Carbohydrate type comparison
Carbohydrate type breakdown side-by-side comparison
3
54%
25%
21%
Starch:
0 g
Sucrose:
0 g
Glucose:
0.26 g
Fructose:
0 g
Lactose:
0.12 g
Maltose:
0 g
Galactose:
0.1 g
2
72%
16%
11%
Starch:
0 g
Sucrose:
0.71 g
Glucose:
0.16 g
Fructose:
0.11 g
Lactose:
0 g
Maltose:
0 g
Galactose:
0 g
Contains
more
Glucose Glucose
+62.5%
Contains
more
Lactose Lactose
+∞%
Contains
more
Galactose Galactose
+∞%
Contains
more
Sucrose Sucrose
+∞%
Contains
more
Fructose Fructose
+∞%
~equal in
Starch
~0g
~equal in
Maltose
~0g