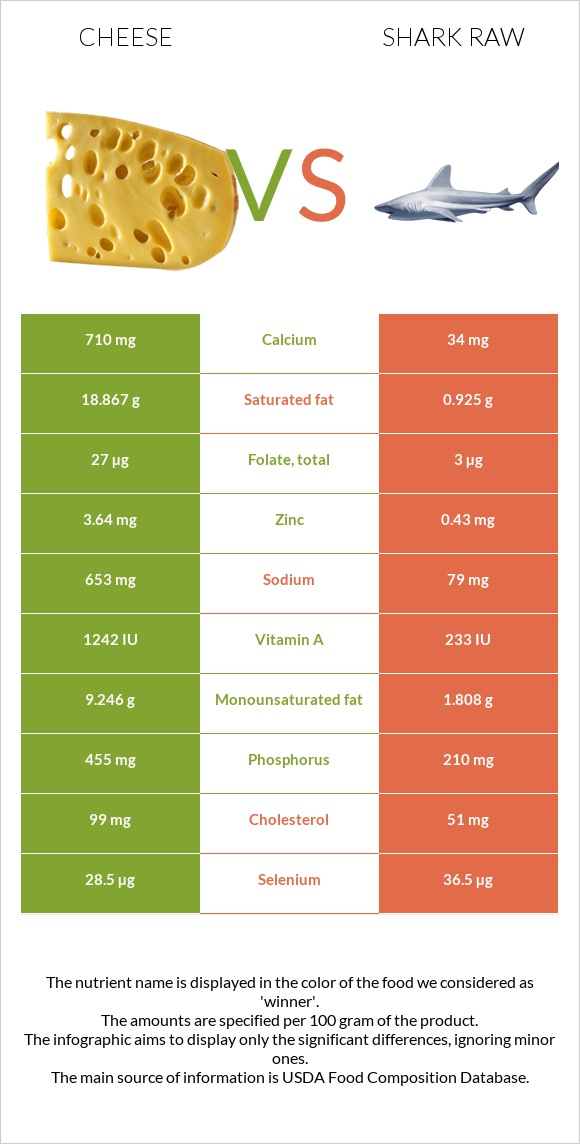
The main differences between cheese and shark raw Cheese is richer in calcium, phosphorus, zinc, vitamin B2, and vitamin A, yet shark raw is richer in vitamin B6, vitamin B3, and vitamin B12. Daily need coverage for saturated fat for cheese is 90% higher. Cheese contains 21 times more calcium than shark raw. Cheese contains 710mg of calcium, while shark raw contains 34mg. Shark raw contains less saturated fat. Food types used in this article are Cheese, cheddar and Fish, shark, mixed species, raw .
Infographic
Mineral Comparison
Mineral comparison score is based on the number of minerals by which one or the other food is richer. The "coverage" charts below show how much of the daily needs can be covered by 300 grams of the food.
4
100 g
300 g
1 cubic inch - 17g 1 slice (1 oz) - 28g 1 oz - 28.35g 1 cup, shredded - 113g 1 cup, diced - 132g 1 cup, melted - 244g
Magnesium
Magnesium
Calcium
Calcium
Potassium
Potassium
Iron
Iron
Copper
Copper
Zinc
Zinc
Phosphorus
Phosphorus
Sodium
Sodium
Manganese
Manganese
Selenium
Selenium
19%
213%
6.7%
5.3%
10%
99%
195%
85%
3.5%
155%
5
100 g
300 g
3 oz - 85g
Magnesium
Magnesium
Calcium
Calcium
Potassium
Potassium
Iron
Iron
Copper
Copper
Zinc
Zinc
Phosphorus
Phosphorus
Sodium
Sodium
Manganese
Manganese
Selenium
Selenium
35%
10%
14%
32%
11%
12%
90%
10%
2%
199%
Vitamin Comparison
Vitamin comparison score is based on the number of vitamins by which one or the other food is richer. The "coverage" charts below show how much of the daily needs can be covered by 300 grams of the food.
4
100 g
300 g
1 cubic inch - 17g 1 slice (1 oz) - 28g 1 oz - 28.35g 1 cup, shredded - 113g 1 cup, diced - 132g 1 cup, melted - 244g
Vitamin C
Vit. C
Vitamin D
Vit. D
Vitamin A
Vit. A
Vitamin E
Vit. E
Vitamin B1
Vit. B1
Vitamin B2
Vit. B2
Vitamin B3
Vit. B3
Vitamin B5
Vit. B5
Vitamin B6
Vit. B6
Vitamin B12
Vit. B12
Vitamin K
Vit. K
Folate
Folate
0%
9%
110%
14%
7.3%
99%
1.1%
25%
15%
138%
6%
20%
6
100 g
300 g
3 oz - 85g
Vitamin C
Vit. C
Vitamin D
Vit. D
Vitamin A
Vit. A
Vitamin E
Vit. E
Vitamin B1
Vit. B1
Vitamin B2
Vit. B2
Vitamin B3
Vit. B3
Vitamin B5
Vit. B5
Vitamin B6
Vit. B6
Vitamin B12
Vit. B12
Vitamin K
Vit. K
Folate
Folate
0%
9%
23%
20%
11%
14%
55%
42%
92%
186%
0.25%
2.3%
All nutrients comparison - raw data values
Nutrient
DV% diff.
Saturated fat
18.867g
0.925g
82%
Calcium
710mg
34mg
68%
Fats
33.31g
4.51g
44%
Phosphorus
455mg
210mg
35%
Zinc
3.64mg
0.43mg
29%
Vitamin A
330µg
70µg
29%
Vitamin B2
0.428mg
0.062mg
28%
Vitamin B6
0.066mg
0.4mg
26%
Sodium
653mg
79mg
25%
Monounsaturated fat
9.246g
1.808g
19%
Vitamin B3
0.059mg
2.938mg
18%
Cholesterol
99mg
51mg
16%
Vitamin B12
1.1µg
1.49µg
16%
Selenium
28.5µg
36.5µg
15%
Calories
404kcal
130kcal
14%
Iron
0.14mg
0.84mg
9%
Choline
16.5mg
65mg
9%
Vitamin B5
0.41mg
0.695mg
6%
Folate
27µg
3µg
6%
Magnesium
27mg
49mg
5%
Protein
22.87g
20.98g
4%
Potassium
76mg
160mg
2%
Vitamin E
0.71mg
1mg
2%
Vitamin K
2.4µg
0.1µg
2%
Polyunsaturated fat
1.421g
1.195g
2%
Carbs
3.09g
0g
1%
Manganese
0.027mg
0.015mg
1%
Vitamin B1
0.029mg
0.042mg
1%
Protein per 100 calories
5.7g
16g
N/A
Calories per 10 g protein
177kcal
62kcal
N/A
Weight per 100 calories
25g
77g
N/A
Unsaturated / Saturated Fat ratio
0.57
3.2
N/A
Net carbs
3.09g
0g
N/A
Vitamin D*
24 IU
24 IU
0%
Vitamin D
0.6µg
0.6µg
0%
Sugar
0.48g
0g
N/A
Copper
0.03mg
0.033mg
0%
Trans fat
0.917g
N/A
Tryptophan
0.547mg
0.235mg
0%
Threonine
1.044mg
0.92mg
0%
Isoleucine
1.206mg
0.967mg
0%
Leucine
1.939mg
1.705mg
0%
Lysine
1.025mg
1.926mg
0%
Methionine
0.547mg
0.621mg
0%
Phenylalanine
1.074mg
0.819mg
0%
Valine
1.404mg
1.081mg
0%
Histidine
0.547mg
0.618mg
0%
Omega-3 - EPA
0.01g
0.316g
N/A
Omega-3 - DHA
0.001g
0.527g
N/A
Omega-3 - DPA
0.017g
0.109g
N/A
Omega-6 - Eicosadienoic acid
0.007g
N/A
Macronutrient Comparison
Macronutrient breakdown side-by-side comparison
4
23%
33%
3%
37%
4%
Protein:
22.87 g
Fats:
33.31 g
Carbs:
3.09 g
Water:
37.02 g
Other:
3.71 g
1
21%
5%
74%
Protein:
20.98 g
Fats:
4.51 g
Carbs:
0 g
Water:
73.58 g
Other:
0.93 g
Contains
more
Fats Fats
+638.6%
Contains
more
Carbs Carbs
+∞%
Contains
more
Other Other
+298.9%
Contains
more
Water Water
+98.8%
~equal in
Protein
~20.98g
Fat Type Comparison
Fat type breakdown side-by-side comparison
2
64%
31%
5%
Saturated fat:
Sat. Fat
18.867 g
Monounsaturated fat:
Mono. Fat
9.246 g
Polyunsaturated fat:
Poly. Fat
1.421 g
1
24%
46%
30%
Saturated fat:
Sat. Fat
0.925 g
Monounsaturated fat:
Mono. Fat
1.808 g
Polyunsaturated fat:
Poly. Fat
1.195 g
Contains
more
Mono. Fat Monounsaturated fat
+411.4%
Contains
more
Poly. Fat Polyunsaturated fat
+18.9%
Contains
less
Sat. Fat Saturated fat
-95.1%