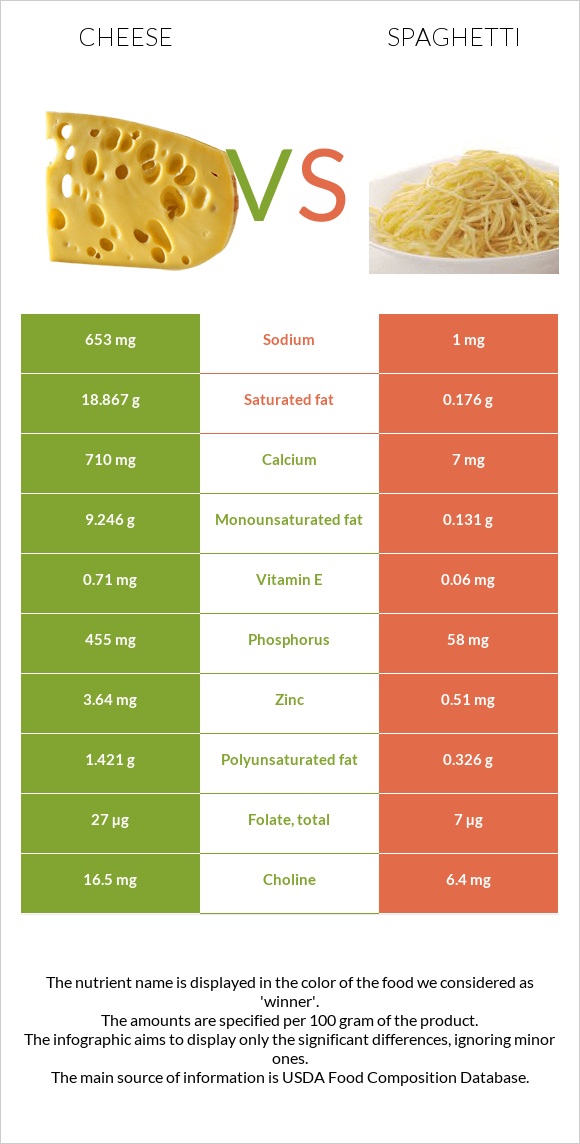
Significant differences between cheese and spaghetti Cheese has more calcium, phosphorus, vitamin B12, vitamin B2, zinc, and vitamin A; however, spaghetti is richer in manganese. Cheese covers your daily saturated fat needs 93% more than spaghetti. Spaghetti contains less cholesterol. Spaghetti has a higher glycemic index. The glycemic index of spaghetti is 49, while the glycemic index of cheese is 0. Specific food types used in this comparison are Cheese, cheddar and Pasta, cooked, unenriched, without added salt .
Infographic
Mineral Comparison
Mineral comparison score is based on the number of minerals by which one or the other food is richer. The "coverage" charts below show how much of the daily needs can be covered by 300 grams of the food.
5
100 g
300 g
1 cubic inch - 17g 1 slice (1 oz) - 28g 1 oz - 28.35g 1 cup, shredded - 113g 1 cup, diced - 132g 1 cup, melted - 244g
Magnesium
Magnesium
Calcium
Calcium
Potassium
Potassium
Iron
Iron
Copper
Copper
Zinc
Zinc
Phosphorus
Phosphorus
Sodium
Sodium
Manganese
Manganese
Selenium
Selenium
19%
213%
6.7%
5.3%
10%
99%
195%
85%
3.5%
155%
4
100 g
300 g
1 cup shells - 105g 1 cup penne - 107g 1 cup rotini - 107g 1 cup farfalle - 107g 1 cup lasagne - 116g 1 cup elbows not packed - 120g 1 cup spaghetti not packed - 124g 1 cup elbows packed - 132g 1 cup spaghetti packed - 151g
Magnesium
Magnesium
Calcium
Calcium
Potassium
Potassium
Iron
Iron
Copper
Copper
Zinc
Zinc
Phosphorus
Phosphorus
Sodium
Sodium
Manganese
Manganese
Selenium
Selenium
13%
2.1%
3.9%
19%
33%
14%
25%
0.13%
42%
144%
Vitamin Comparison
Vitamin comparison score is based on the number of vitamins by which one or the other food is richer. The "coverage" charts below show how much of the daily needs can be covered by 300 grams of the food.
10
100 g
300 g
1 cubic inch - 17g 1 slice (1 oz) - 28g 1 oz - 28.35g 1 cup, shredded - 113g 1 cup, diced - 132g 1 cup, melted - 244g
Vitamin C
Vit. C
Vitamin D
Vit. D
Vitamin A
Vit. A
Vitamin E
Vit. E
Vitamin B1
Vit. B1
Vitamin B2
Vit. B2
Vitamin B3
Vit. B3
Vitamin B5
Vit. B5
Vitamin B6
Vit. B6
Vitamin B12
Vit. B12
Vitamin K
Vit. K
Folate
Folate
0%
9%
110%
14%
7.3%
99%
1.1%
25%
15%
138%
6%
20%
1
100 g
300 g
1 cup shells - 105g 1 cup penne - 107g 1 cup rotini - 107g 1 cup farfalle - 107g 1 cup lasagne - 116g 1 cup elbows not packed - 120g 1 cup spaghetti not packed - 124g 1 cup elbows packed - 132g 1 cup spaghetti packed - 151g
Vitamin C
Vit. C
Vitamin D
Vit. D
Vitamin A
Vit. A
Vitamin E
Vit. E
Vitamin B1
Vit. B1
Vitamin B2
Vit. B2
Vitamin B3
Vit. B3
Vitamin B5
Vit. B5
Vitamin B6
Vit. B6
Vitamin B12
Vit. B12
Vitamin K
Vit. K
Folate
Folate
0%
0%
0%
1.2%
5%
4.6%
7.5%
6.7%
11%
0%
0%
5.3%
All nutrients comparison - raw data values
Nutrient
DV% diff.
Saturated fat
18.867g
0.176g
85%
Calcium
710mg
7mg
70%
Phosphorus
455mg
58mg
57%
Fats
33.31g
0.93g
50%
Vitamin B12
1.1µg
0µg
46%
Vitamin A
330µg
0µg
37%
Protein
22.87g
5.8g
34%
Cholesterol
99mg
0mg
33%
Vitamin B2
0.428mg
0.02mg
31%
Zinc
3.64mg
0.51mg
28%
Sodium
653mg
1mg
28%
Monounsaturated fat
9.246g
0.131g
23%
Manganese
0.027mg
0.322mg
13%
Calories
404kcal
158kcal
12%
Starch
26.01g
11%
Carbs
3.09g
30.86g
9%
Copper
0.03mg
0.1mg
8%
Fiber
0g
1.8g
7%
Polyunsaturated fat
1.421g
0.326g
7%
Vitamin B5
0.41mg
0.112mg
6%
Iron
0.14mg
0.5mg
5%
Folate
27µg
7µg
5%
Vitamin E
0.71mg
0.06mg
4%
Selenium
28.5µg
26.4µg
4%
Vitamin D*
24 IU
0 IU
3%
Vitamin D
0.6µg
0µg
3%
Magnesium
27mg
18mg
2%
Vitamin B3
0.059mg
0.4mg
2%
Vitamin K
2.4µg
0µg
2%
Choline
16.5mg
6.4mg
2%
Potassium
76mg
44mg
1%
Vitamin B1
0.029mg
0.02mg
1%
Vitamin B6
0.066mg
0.049mg
1%
Protein per 100 calories
5.7g
3.7g
N/A
Calories per 10 g protein
177kcal
272kcal
N/A
Weight per 100 calories
25g
63g
N/A
Unsaturated / Saturated Fat ratio
0.57
2.6
N/A
Net carbs
3.09g
29.06g
N/A
Sugar
0.48g
0.56g
N/A
Trans fat
0.917g
0g
N/A
Tryptophan
0.547mg
0.083mg
0%
Threonine
1.044mg
0.206mg
0%
Isoleucine
1.206mg
0.228mg
0%
Leucine
1.939mg
0.44mg
0%
Lysine
1.025mg
0.133mg
0%
Methionine
0.547mg
0.065mg
0%
Phenylalanine
1.074mg
0.297mg
0%
Valine
1.404mg
0.262mg
0%
Histidine
0.547mg
0.132mg
0%
Fructose
0g
0.03g
0%
Omega-3 - EPA
0.01g
0g
N/A
Omega-3 - DHA
0.001g
0g
N/A
Omega-3 - ALA
0.024g
N/A
Omega-3 - DPA
0.017g
0g
N/A
Omega-6 - Eicosadienoic acid
0.007g
0g
N/A
Macronutrient Comparison
Macronutrient breakdown side-by-side comparison
3
23%
33%
3%
37%
4%
Protein:
22.87 g
Fats:
33.31 g
Carbs:
3.09 g
Water:
37.02 g
Other:
3.71 g
2
6%
31%
62%
Protein:
5.8 g
Fats:
0.93 g
Carbs:
30.86 g
Water:
62.13 g
Other:
0.28 g
Contains
more
Protein Protein
+294.3%
Contains
more
Fats Fats
+3481.7%
Contains
more
Other Other
+1225%
Contains
more
Carbs Carbs
+898.7%
Contains
more
Water Water
+67.8%
Fat Type Comparison
Fat type breakdown side-by-side comparison
2
64%
31%
5%
Saturated fat:
Sat. Fat
18.867 g
Monounsaturated fat:
Mono. Fat
9.246 g
Polyunsaturated fat:
Poly. Fat
1.421 g
1
28%
21%
52%
Saturated fat:
Sat. Fat
0.176 g
Monounsaturated fat:
Mono. Fat
0.131 g
Polyunsaturated fat:
Poly. Fat
0.326 g
Contains
more
Mono. Fat Monounsaturated fat
+6958%
Contains
more
Poly. Fat Polyunsaturated fat
+335.9%
Contains
less
Sat. Fat Saturated fat
-99.1%
Carbohydrate type comparison
Carbohydrate type breakdown side-by-side comparison
3
54%
25%
21%
Starch:
0 g
Sucrose:
0 g
Glucose:
0.26 g
Fructose:
0 g
Lactose:
0.12 g
Maltose:
0 g
Galactose:
0.1 g
4
98%
Starch:
26.01 g
Sucrose:
0.09 g
Glucose:
0.04 g
Fructose:
0.03 g
Lactose:
0 g
Maltose:
0.4 g
Galactose:
0 g
Contains
more
Glucose Glucose
+550%
Contains
more
Lactose Lactose
+∞%
Contains
more
Galactose Galactose
+∞%
Contains
more
Starch Starch
+∞%
Contains
more
Sucrose Sucrose
+∞%
Contains
more
Fructose Fructose
+∞%
Contains
more
Maltose Maltose
+∞%