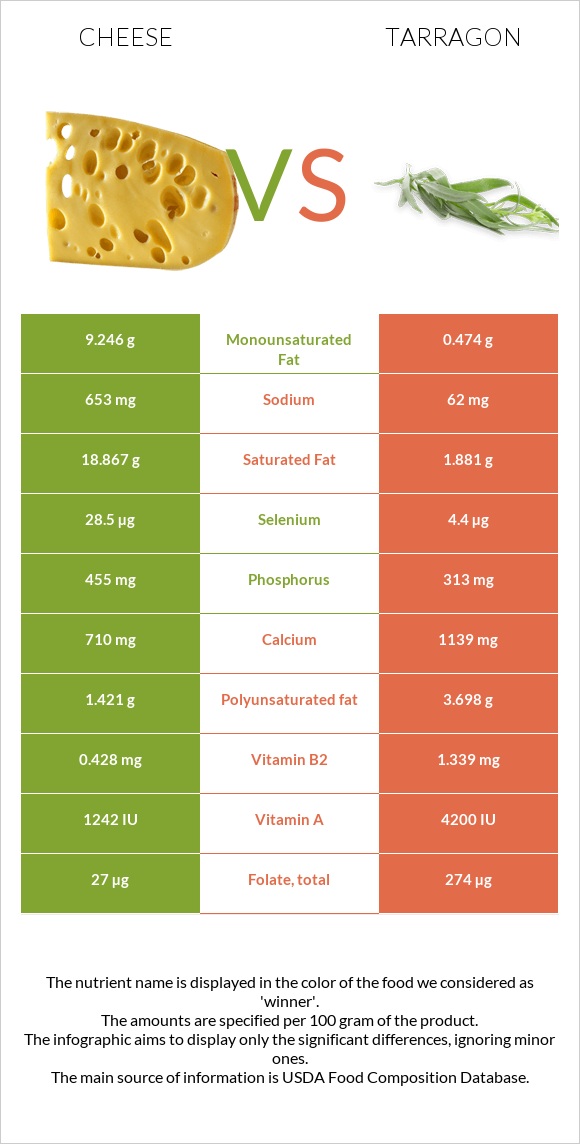
Significant differences between cheese and tarragon The amount of iron, manganese, vitamin B6, potassium, magnesium, copper, vitamin B2, folate, and vitamin A in tarragon is higher than in cheese. Tarragon covers your daily iron needs 402% more than cheese. Tarragon has 10 times less saturated fat than cheese. Cheese has 18.867g of saturated fat, while tarragon has 1.881g. Specific food types used in this comparison are Cheese, cheddar and Spices, tarragon, dried .
Infographic
Mineral Comparison
Mineral comparison score is based on the number of minerals by which one or the other food is richer. The "coverage" charts below show how much of the daily needs can be covered by 300 grams of the food.
2
100 g
300 g
1 cubic inch - 17g 1 slice (1 oz) - 28g 1 oz - 28.35g 1 cup, shredded - 113g 1 cup, diced - 132g 1 cup, melted - 244g
Magnesium
Magnesium
Calcium
Calcium
Potassium
Potassium
Iron
Iron
Copper
Copper
Zinc
Zinc
Phosphorus
Phosphorus
Sodium
Sodium
Manganese
Manganese
Selenium
Selenium
19%
213%
6.7%
5.3%
10%
99%
195%
85%
3.5%
155%
7
100 g
300 g
0.25 tsp - 0.5g 1 tsp, ground - 1.6g 1 tbsp, leaves - 1.8g 1 tbsp, ground - 4.8g
Magnesium
Magnesium
Calcium
Calcium
Potassium
Potassium
Iron
Iron
Copper
Copper
Zinc
Zinc
Phosphorus
Phosphorus
Sodium
Sodium
Manganese
Manganese
Selenium
Selenium
248%
342%
266%
1211%
226%
106%
134%
8.1%
1039%
24%
Vitamin Comparison
Vitamin comparison score is based on the number of vitamins by which one or the other food is richer. The "coverage" charts below show how much of the daily needs can be covered by 300 grams of the food.
6
100 g
300 g
1 cubic inch - 17g 1 slice (1 oz) - 28g 1 oz - 28.35g 1 cup, shredded - 113g 1 cup, diced - 132g 1 cup, melted - 244g
Vitamin C
Vit. C
Vitamin D
Vit. D
Vitamin A
Vit. A
Vitamin E
Vit. E
Vitamin B1
Vit. B1
Vitamin B2
Vit. B2
Vitamin B3
Vit. B3
Vitamin B5
Vit. B5
Vitamin B6
Vit. B6
Vitamin B12
Vit. B12
Vitamin K
Vit. K
Folate
Folate
0%
9%
110%
14%
7.3%
99%
1.1%
25%
15%
138%
6%
20%
6
100 g
300 g
0.25 tsp - 0.5g 1 tsp, ground - 1.6g 1 tbsp, leaves - 1.8g 1 tbsp, ground - 4.8g
Vitamin C
Vit. C
Vitamin D
Vit. D
Vitamin A
Vit. A
Vitamin E
Vit. E
Vitamin B1
Vit. B1
Vitamin B2
Vit. B2
Vitamin B3
Vit. B3
Vitamin B5
Vit. B5
Vitamin B6
Vit. B6
Vitamin B12
Vit. B12
Vitamin K
Vit. K
Folate
Folate
167%
0%
70%
0%
63%
309%
168%
0%
556%
0%
0%
206%
All nutrients comparison - raw data values
Nutrient
DV% diff.
Iron
0.14mg
32.3mg
402%
Manganese
0.027mg
7.967mg
345%
Vitamin B6
0.066mg
2.41mg
180%
Potassium
76mg
3020mg
87%
Saturated fat
18.867g
1.881g
77%
Magnesium
27mg
347mg
76%
Copper
0.03mg
0.677mg
72%
Vitamin B2
0.428mg
1.339mg
70%
Folate
27µg
274µg
62%
Vitamin C
0mg
50mg
56%
Vitamin B3
0.059mg
8.95mg
56%
Vitamin B12
1.1µg
0µg
46%
Selenium
28.5µg
4.4µg
44%
Calcium
710mg
1139mg
43%
Fats
33.31g
7.24g
40%
Cholesterol
99mg
0mg
33%
Fiber
0g
7.4g
30%
Sodium
653mg
62mg
26%
Monounsaturated fat
9.246g
0.474g
22%
Phosphorus
455mg
313mg
20%
Vitamin B1
0.029mg
0.251mg
19%
Carbs
3.09g
50.22g
16%
Polyunsaturated fat
1.421g
3.698g
15%
Vitamin A
330µg
210µg
13%
Vitamin B5
0.41mg
8%
Calories
404kcal
295kcal
5%
Vitamin E
0.71mg
5%
Vitamin D*
24 IU
0 IU
3%
Vitamin D
0.6µg
0µg
3%
Choline
16.5mg
3%
Zinc
3.64mg
3.9mg
2%
Vitamin K
2.4µg
2%
Protein
22.87g
22.77g
0%
Protein per 100 calories
5.7g
7.7g
N/A
Calories per 10 g protein
177kcal
130kcal
N/A
Weight per 100 calories
25g
34g
N/A
Unsaturated / Saturated Fat ratio
0.57
2.2
N/A
Net carbs
3.09g
42.82g
N/A
Sugar
0.48g
N/A
Trans fat
0.917g
0g
N/A
Tryptophan
0.547mg
0%
Threonine
1.044mg
0%
Isoleucine
1.206mg
0%
Leucine
1.939mg
0%
Lysine
1.025mg
0%
Methionine
0.547mg
0%
Phenylalanine
1.074mg
0%
Valine
1.404mg
0%
Histidine
0.547mg
0%
Omega-3 - EPA
0.01g
0g
N/A
Omega-3 - DHA
0.001g
0g
N/A
Omega-3 - DPA
0.017g
0g
N/A
Omega-6 - Eicosadienoic acid
0.007g
N/A
Macronutrient Comparison
Macronutrient breakdown side-by-side comparison
3
23%
33%
3%
37%
4%
Protein:
22.87 g
Fats:
33.31 g
Carbs:
3.09 g
Water:
37.02 g
Other:
3.71 g
2
23%
7%
50%
8%
12%
Protein:
22.77 g
Fats:
7.24 g
Carbs:
50.22 g
Water:
7.74 g
Other:
12.03 g
Contains
more
Fats Fats
+360.1%
Contains
more
Water Water
+378.3%
Contains
more
Carbs Carbs
+1525.2%
Contains
more
Other Other
+224.3%
~equal in
Protein
~22.77g
Fat Type Comparison
Fat type breakdown side-by-side comparison
1
64%
31%
5%
Saturated fat:
Sat. Fat
18.867 g
Monounsaturated fat:
Mono. Fat
9.246 g
Polyunsaturated fat:
Poly. Fat
1.421 g
2
31%
8%
61%
Saturated fat:
Sat. Fat
1.881 g
Monounsaturated fat:
Mono. Fat
0.474 g
Polyunsaturated fat:
Poly. Fat
3.698 g
Contains
more
Mono. Fat Monounsaturated fat
+1850.6%
Contains
less
Sat. Fat Saturated fat
-90%
Contains
more
Poly. Fat Polyunsaturated fat
+160.2%