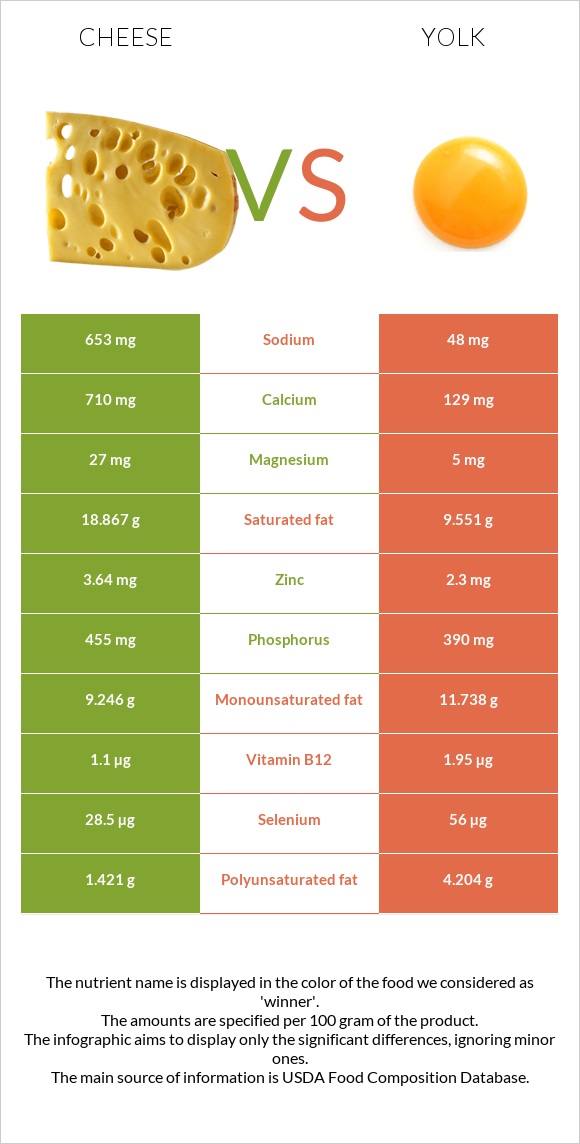
The main differences between cheese and yolk Cheese is richer in calcium, yet yolk is richer in choline, vitamin B5, selenium, vitamin B12, iron, and folate. Daily need coverage for cholesterol for yolk is 329% higher. Cheese contains 14 times more sodium than yolk. Cheese contains 653mg of sodium, while yolk contains 48mg. Food types used in this article are Cheese, cheddar and Egg, yolk, raw, fresh .
Infographic
Mineral Comparison
Mineral comparison score is based on the number of minerals by which one or the other food is richer. The "coverage" charts below show how much of the daily needs can be covered by 300 grams of the food.
4
100 g
300 g
1 cubic inch - 17g 1 slice (1 oz) - 28g 1 oz - 28.35g 1 cup, shredded - 113g 1 cup, diced - 132g 1 cup, melted - 244g
Magnesium
Magnesium
Calcium
Calcium
Potassium
Potassium
Iron
Iron
Copper
Copper
Zinc
Zinc
Phosphorus
Phosphorus
Sodium
Sodium
Manganese
Manganese
Selenium
Selenium
19%
213%
6.7%
5.3%
10%
99%
195%
85%
3.5%
155%
6
100 g
300 g
1 large - 17g 1 cup - 243g
Magnesium
Magnesium
Calcium
Calcium
Potassium
Potassium
Iron
Iron
Copper
Copper
Zinc
Zinc
Phosphorus
Phosphorus
Sodium
Sodium
Manganese
Manganese
Selenium
Selenium
3.6%
39%
9.6%
102%
26%
63%
167%
6.3%
7.2%
305%
Vitamin Comparison
Vitamin comparison score is based on the number of vitamins by which one or the other food is richer. The "coverage" charts below show how much of the daily needs can be covered by 300 grams of the food.
2
100 g
300 g
1 cubic inch - 17g 1 slice (1 oz) - 28g 1 oz - 28.35g 1 cup, shredded - 113g 1 cup, diced - 132g 1 cup, melted - 244g
Vitamin C
Vit. C
Vitamin D
Vit. D
Vitamin A
Vit. A
Vitamin E
Vit. E
Vitamin B1
Vit. B1
Vitamin B2
Vit. B2
Vitamin B3
Vit. B3
Vitamin B5
Vit. B5
Vitamin B6
Vit. B6
Vitamin B12
Vit. B12
Vitamin K
Vit. K
Folate
Folate
0%
9%
110%
14%
7.3%
99%
1.1%
25%
15%
138%
6%
20%
9
100 g
300 g
1 large - 17g 1 cup - 243g
Vitamin C
Vit. C
Vitamin D
Vit. D
Vitamin A
Vit. A
Vitamin E
Vit. E
Vitamin B1
Vit. B1
Vitamin B2
Vit. B2
Vitamin B3
Vit. B3
Vitamin B5
Vit. B5
Vitamin B6
Vit. B6
Vitamin B12
Vit. B12
Vitamin K
Vit. K
Folate
Folate
0%
81%
127%
52%
44%
122%
0.45%
179%
81%
244%
1.8%
110%
All nutrients comparison - raw data values
Nutrient
DV% diff.
Cholesterol
99mg
1085mg
329%
Choline
16.5mg
820.2mg
146%
Calcium
710mg
129mg
58%
Vitamin B5
0.41mg
2.99mg
52%
Selenium
28.5µg
56µg
50%
Saturated fat
18.867g
9.551g
42%
Vitamin B12
1.1µg
1.95µg
35%
Iron
0.14mg
2.73mg
32%
Folate
27µg
146µg
30%
Sodium
653mg
48mg
26%
Vitamin D*
24 IU
218 IU
24%
Vitamin D
0.6µg
5.4µg
24%
Vitamin B6
0.066mg
0.35mg
22%
Polyunsaturated fat
1.421g
4.204g
19%
Protein
22.87g
15.86g
14%
Zinc
3.64mg
2.3mg
12%
Vitamin E
0.71mg
2.58mg
12%
Vitamin B1
0.029mg
0.176mg
12%
Fats
33.31g
26.54g
10%
Phosphorus
455mg
390mg
9%
Vitamin B2
0.428mg
0.528mg
8%
Vitamin A
330µg
381µg
6%
Monounsaturated fat
9.246g
11.738g
6%
Magnesium
27mg
5mg
5%
Copper
0.03mg
0.077mg
5%
Calories
404kcal
322kcal
4%
Potassium
76mg
109mg
1%
Manganese
0.027mg
0.055mg
1%
Vitamin K
2.4µg
0.7µg
1%
Protein per 100 calories
5.7g
4.9g
N/A
Calories per 10 g protein
177kcal
203kcal
N/A
Weight per 100 calories
25g
31g
N/A
Unsaturated / Saturated Fat ratio
0.57
1.7
N/A
Net carbs
3.09g
3.59g
N/A
Carbs
3.09g
3.59g
0%
Sugar
0.48g
0.56g
N/A
Vitamin B3
0.059mg
0.024mg
0%
Trans fat
0.917g
N/A
Tryptophan
0.547mg
0.177mg
0%
Threonine
1.044mg
0.687mg
0%
Isoleucine
1.206mg
0.866mg
0%
Leucine
1.939mg
1.399mg
0%
Lysine
1.025mg
1.217mg
0%
Methionine
0.547mg
0.378mg
0%
Phenylalanine
1.074mg
0.681mg
0%
Valine
1.404mg
0.949mg
0%
Histidine
0.547mg
0.416mg
0%
Fructose
0g
0.07g
0%
Omega-3 - EPA
0.01g
0.011g
N/A
Omega-3 - DHA
0.001g
0.114g
N/A
Omega-3 - DPA
0.017g
0g
N/A
Omega-6 - Eicosadienoic acid
0.007g
N/A
Macronutrient Comparison
Macronutrient breakdown side-by-side comparison
3
23%
33%
3%
37%
4%
Protein:
22.87 g
Fats:
33.31 g
Carbs:
3.09 g
Water:
37.02 g
Other:
3.71 g
2
16%
27%
4%
52%
2%
Protein:
15.86 g
Fats:
26.54 g
Carbs:
3.59 g
Water:
52.31 g
Other:
1.7 g
Contains
more
Protein Protein
+44.2%
Contains
more
Fats Fats
+25.5%
Contains
more
Other Other
+118.2%
Contains
more
Carbs Carbs
+16.2%
Contains
more
Water Water
+41.3%
Fat Type Comparison
Fat type breakdown side-by-side comparison
0
64%
31%
5%
Saturated fat:
Sat. Fat
18.867 g
Monounsaturated fat:
Mono. Fat
9.246 g
Polyunsaturated fat:
Poly. Fat
1.421 g
3
37%
46%
16%
Saturated fat:
Sat. Fat
9.551 g
Monounsaturated fat:
Mono. Fat
11.738 g
Polyunsaturated fat:
Poly. Fat
4.204 g
Contains
less
Sat. Fat Saturated fat
-49.4%
Contains
more
Mono. Fat Monounsaturated fat
+27%
Contains
more
Poly. Fat Polyunsaturated fat
+195.8%
Carbohydrate type comparison
Carbohydrate type breakdown side-by-side comparison
3
54%
25%
21%
Starch:
0 g
Sucrose:
0 g
Glucose:
0.26 g
Fructose:
0 g
Lactose:
0.12 g
Maltose:
0 g
Galactose:
0.1 g
3
13%
34%
13%
13%
13%
13%
Starch:
0 g
Sucrose:
0.07 g
Glucose:
0.18 g
Fructose:
0.07 g
Lactose:
0.07 g
Maltose:
0.07 g
Galactose:
0.07 g
Contains
more
Glucose Glucose
+44.4%
Contains
more
Lactose Lactose
+71.4%
Contains
more
Galactose Galactose
+42.9%
Contains
more
Sucrose Sucrose
+∞%
Contains
more
Fructose Fructose
+∞%
Contains
more
Maltose Maltose
+∞%