Cheeseburger vs. Chicken teriyaki subway — In-Depth Nutrition Comparison
Compare
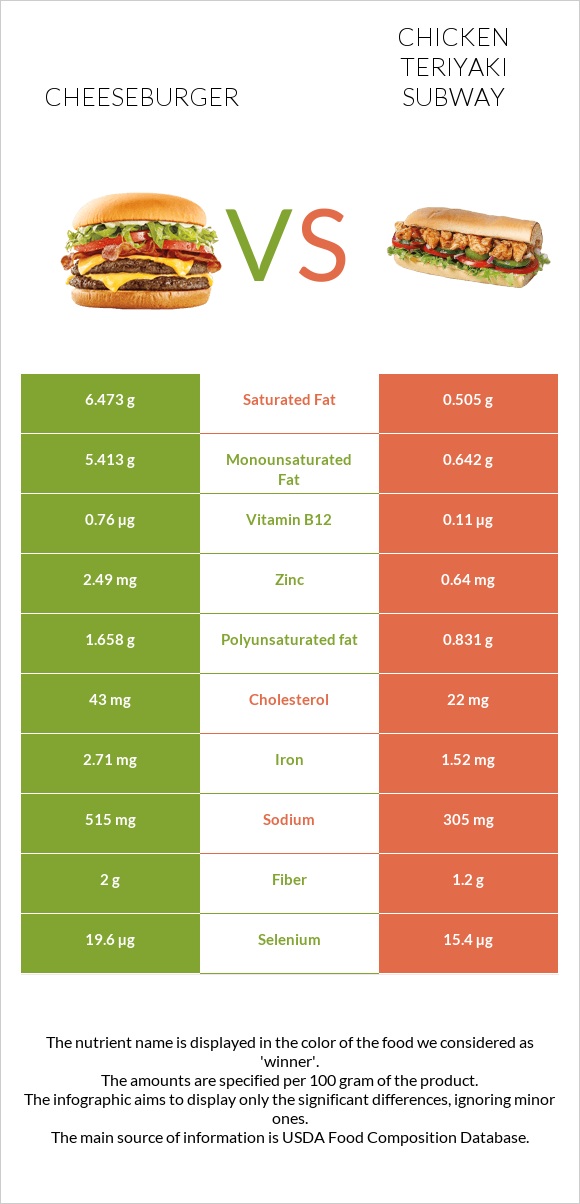
How are cheeseburgers and chicken teriyaki subway different?
- Cheeseburgers have more vitamin B12, zinc, iron, vitamin B2, and selenium than chicken teriyaki subway.
- Daily need coverage for saturated fat for cheeseburgers is 30% higher.
- Cheeseburgers contain 7 times more vitamin B12 than chicken teriyaki subway. While cheeseburgers contain 0.76µg of vitamin B12, chicken teriyaki subway contains only 0.11µg.
- Chicken teriyaki subway has less saturated fat.
Fast foods, cheeseburger; single, regular patty; plain and SUBWAY, sweet onion chicken teriyaki sub on white bread with lettuce, tomato, and sweet onion sauce are the varieties used in this article.
Infographic
Infographic link
Mineral Comparison
Mineral comparison score is based on the number of minerals by which one or the other food is richer. The "coverage" charts below show how much of the daily needs can be covered by 300 grams of the food.
| Contains more MagnesiumMagnesium | +13% |
| Contains more IronIron | +78.3% |
| Contains more CopperCopper | +56.3% |
| Contains more ZincZinc | +289.1% |
| Contains more PhosphorusPhosphorus | +15.8% |
| Contains more ManganeseManganese | +12.1% |
| Contains more SeleniumSelenium | +27.3% |
| Contains more CalciumCalcium | +19.3% |
| Contains more PotassiumPotassium | +45.4% |
| Contains less SodiumSodium | -40.8% |
Vitamin Comparison
Vitamin comparison score is based on the number of vitamins by which one or the other food is richer. The "coverage" charts below show how much of the daily needs can be covered by 300 grams of the food.
| Contains more Vitamin DVitamin D | +∞% |
| Contains more Vitamin AVitamin A | +1566.7% |
| Contains more Vitamin EVitamin E | +36.8% |
| Contains more Vitamin B2Vitamin B2 | +70.4% |
| Contains more Vitamin B12Vitamin B12 | +590.9% |
| Contains more Vitamin KVitamin K | +∞% |
| Contains more FolateFolate | +20.7% |
| Contains more Vitamin CVitamin C | +∞% |
| Contains more Vitamin B5Vitamin B5 | +20.2% |
| Contains more Vitamin B6Vitamin B6 | +23.7% |
All nutrients comparison - raw data values
| Nutrient |  |
 |
DV% diff. |
| Vitamin B12 | 0.76µg | 0.11µg | 27% |
| Saturated fat | 6.473g | 0.505g | 27% |
| Fats | 14.72g | 2.37g | 19% |
| Zinc | 2.49mg | 0.64mg | 17% |
| Iron | 2.71mg | 1.52mg | 15% |
| Vitamin B2 | 0.363mg | 0.213mg | 12% |
| Monounsaturated fat | 5.413g | 0.642g | 12% |
| Protein | 16.51g | 10.91g | 11% |
| Sodium | 515mg | 305mg | 9% |
| Calories | 308kcal | 155kcal | 8% |
| Selenium | 19.6µg | 15.4µg | 8% |
| Cholesterol | 43mg | 22mg | 7% |
| Polyunsaturated fat | 1.658g | 0.831g | 6% |
| Vitamin A | 50µg | 3µg | 5% |
| Choline | 28.9mg | 5% | |
| Copper | 0.111mg | 0.071mg | 4% |
| Vitamin B6 | 0.228mg | 0.282mg | 4% |
| Vitamin K | 4.2µg | 4% | |
| Potassium | 196mg | 285mg | 3% |
| Fiber | 2g | 1.2g | 3% |
| Starch | 19.87g | 13.77g | 3% |
| Phosphorus | 161mg | 139mg | 3% |
| Folate | 70µg | 58µg | 3% |
| Carbs | 28.03g | 22.54g | 2% |
| Calcium | 119mg | 142mg | 2% |
| Vitamin B1 | 0.293mg | 0.273mg | 2% |
| Vitamin B5 | 0.545mg | 0.655mg | 2% |
| Vitamin C | 0mg | 1.1mg | 1% |
| Vitamin D | 0.1µg | 1% | |
| Magnesium | 26mg | 23mg | 1% |
| Vitamin E | 0.52mg | 0.38mg | 1% |
| Manganese | 0.316mg | 0.282mg | 1% |
| Vitamin B3 | 5.217mg | 5.063mg | 1% |
| Fructose | 1.94g | 2.39g | 1% |
| Protein per 100 calories | 5.4g | 7g | N/A |
| Calories per 10 g protein | 187kcal | 142kcal | N/A |
| Weight per 100 calories | 32g | 65g | N/A |
| Unsaturated / Saturated Fat ratio | 1.1 | 2.9 | N/A |
| Net carbs | 26.03g | 21.34g | N/A |
| Vitamin D* | 2 IU | 0% | |
| Sugar | 4.88g | 6.06g | N/A |
| Trans fat | 0.57g | 0.012g | N/A |
| Tryptophan | 0.155mg | 0% | |
| Threonine | 0.571mg | 0% | |
| Isoleucine | 0.755mg | 0% | |
| Leucine | 1.316mg | 0% | |
| Lysine | 0.784mg | 0% | |
| Methionine | 0.377mg | 0% | |
| Phenylalanine | 0.755mg | 0% | |
| Valine | 0.881mg | 0% | |
| Histidine | 0.445mg | 0% | |
| Omega-3 - EPA | 0.005g | 0.001g | N/A |
| Omega-3 - DHA | 0g | 0.001g | N/A |
| Omega-3 - ALA | 0.125g | 0.061g | N/A |
| Omega-3 - DPA | 0.01g | 0.003g | N/A |
| Omega-3 - Eicosatrienoic acid | 0.001g | 0g | N/A |
| Omega-6 - Gamma-linoleic acid | 0.005g | 0.002g | N/A |
| Omega-6 - Dihomo-gamma-linoleic acid | 0.015g | 0.005g | N/A |
| Omega-6 - Eicosadienoic acid | 0.004g | 0.003g | N/A |
| Omega-6 - Linoleic acid | 1.322g | 0.717g | N/A |
Macronutrient Comparison
Macronutrient breakdown side-by-side comparison
Protein:
16.51 g
Fats:
14.72 g
Carbs:
28.03 g
Water:
38.63 g
Other:
2.11 g
Protein:
10.91 g
Fats:
2.37 g
Carbs:
22.54 g
Water:
62.4 g
Other:
1.78 g
| Contains more ProteinProtein | +51.3% |
| Contains more FatsFats | +521.1% |
| Contains more CarbsCarbs | +24.4% |
| Contains more OtherOther | +18.5% |
| Contains more WaterWater | +61.5% |
Fat Type Comparison
Fat type breakdown side-by-side comparison
Saturated fat:
Sat. Fat
6.473 g
Monounsaturated fat:
Mono. Fat
5.413 g
Polyunsaturated fat:
Poly. Fat
1.658 g
Saturated fat:
Sat. Fat
0.505 g
Monounsaturated fat:
Mono. Fat
0.642 g
Polyunsaturated fat:
Poly. Fat
0.831 g
| Contains more Mono. FatMonounsaturated fat | +743.1% |
| Contains more Poly. FatPolyunsaturated fat | +99.5% |
| Contains less Sat. FatSaturated fat | -92.2% |
Carbohydrate type comparison
Carbohydrate type breakdown side-by-side comparison
Starch:
19.87 g
Sucrose:
0 g
Glucose:
1.76 g
Fructose:
1.94 g
Lactose:
0.72 g
Maltose:
0.46 g
Galactose:
0 g
Starch:
13.77 g
Sucrose:
0.79 g
Glucose:
2.23 g
Fructose:
2.39 g
Lactose:
0 g
Maltose:
0.65 g
Galactose:
0 g
| Contains more StarchStarch | +44.3% |
| Contains more LactoseLactose | +∞% |
| Contains more SucroseSucrose | +∞% |
| Contains more GlucoseGlucose | +26.7% |
| Contains more FructoseFructose | +23.2% |
| Contains more MaltoseMaltose | +41.3% |
~equal in
Galactose
~0g


