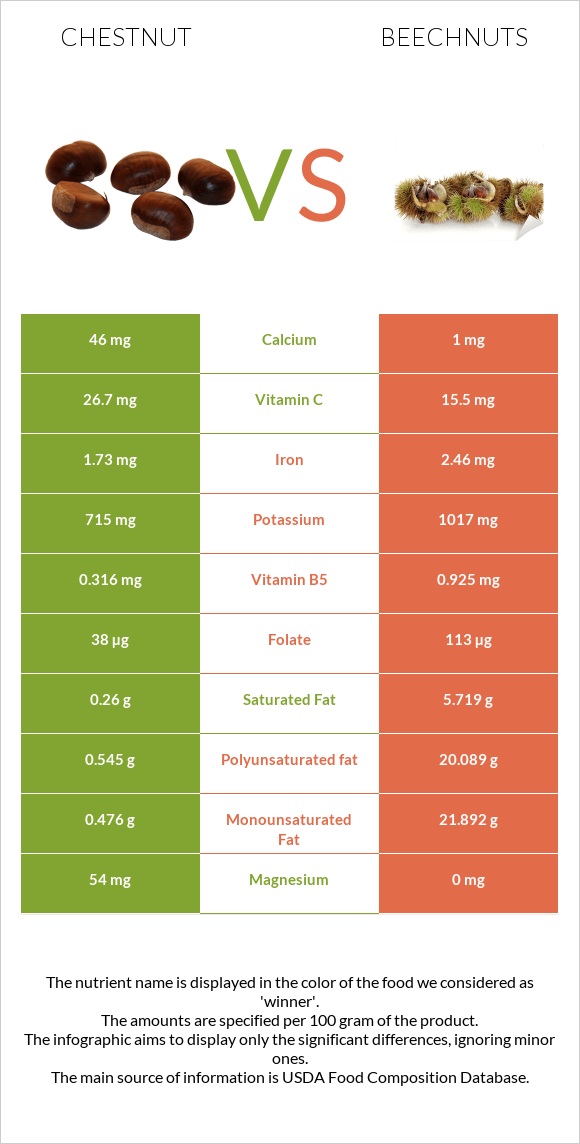
How are chestnut and beechnuts different? Chestnut is richer in phosphorus, magnesium, and vitamin C, while beechnuts are higher in vitamin B6, copper, manganese, vitamin B2, folate, and vitamin B1. Beechnuts cover your daily need for vitamin B6, 35% more than chestnut. Chestnut is lower in saturated fat. Nuts, chestnuts, european, boiled, and steamed and Nuts, beechnuts, dried types were used in this article.
Infographic
Mineral Comparison
Mineral comparison score is based on the number of minerals by which one or the other food is richer. The "coverage" charts below show how much of the daily needs can be covered by 300 grams of the food.
4
100 g
300 g
1 oz - 28.35g
Magnesium
Magnesium
Calcium
Calcium
Potassium
Potassium
Iron
Iron
Copper
Copper
Zinc
Zinc
Phosphorus
Phosphorus
Sodium
Sodium
Manganese
Manganese
Selenium
Selenium
39%
14%
63%
65%
157%
6.8%
42%
3.5%
111%
0%
5
100 g
300 g
1 oz - 28.35g
Magnesium
Magnesium
Calcium
Calcium
Potassium
Potassium
Iron
Iron
Copper
Copper
Zinc
Zinc
Phosphorus
Phosphorus
Sodium
Sodium
Manganese
Manganese
Selenium
Selenium
0%
0.3%
90%
92%
223%
9.8%
0%
5%
175%
0%
Vitamin Comparison
Vitamin comparison score is based on the number of vitamins by which one or the other food is richer. The "coverage" charts below show how much of the daily needs can be covered by 300 grams of the food.
2
100 g
300 g
1 oz - 28.35g
Vitamin C
Vit. C
Vitamin D
Vit. D
Vitamin A
Vit. A
Vitamin E
Vit. E
Vitamin B1
Vit. B1
Vitamin B2
Vit. B2
Vitamin B3
Vit. B3
Vitamin B5
Vit. B5
Vitamin B6
Vit. B6
Vitamin B12
Vit. B12
Vitamin K
Vit. K
Folate
Folate
89%
0%
0.33%
0%
37%
24%
14%
19%
54%
0%
0%
29%
6
100 g
300 g
1 oz - 28.35g
Vitamin C
Vit. C
Vitamin D
Vit. D
Vitamin A
Vit. A
Vitamin E
Vit. E
Vitamin B1
Vit. B1
Vitamin B2
Vit. B2
Vitamin B3
Vit. B3
Vitamin B5
Vit. B5
Vitamin B6
Vit. B6
Vitamin B12
Vit. B12
Vitamin K
Vit. K
Folate
Folate
52%
0%
0%
0%
76%
86%
16%
56%
158%
0%
0%
85%
All nutrients comparison - raw data values
Nutrient
DV% diff.
Polyunsaturated fat
0.545g
20.089g
130%
Fats
1.38g
50g
75%
Monounsaturated fat
0.476g
21.892g
54%
Vitamin B6
0.233mg
0.684mg
35%
Saturated fat
0.26g
5.719g
25%
Calories
131kcal
576kcal
22%
Copper
0.472mg
0.67mg
22%
Manganese
0.854mg
1.341mg
21%
Vitamin B2
0.104mg
0.371mg
21%
Folate
38µg
113µg
19%
Phosphorus
99mg
0mg
14%
Magnesium
54mg
0mg
13%
Vitamin B1
0.148mg
0.304mg
13%
Vitamin C
26.7mg
15.5mg
12%
Vitamin B5
0.316mg
0.925mg
12%
Potassium
715mg
1017mg
9%
Iron
1.73mg
2.46mg
9%
Protein
2g
6.2g
8%
Calcium
46mg
1mg
5%
Carbs
27.76g
33.5g
2%
Zinc
0.25mg
0.36mg
1%
Vitamin B3
0.731mg
0.877mg
1%
Protein per 100 calories
1.5g
1.1g
N/A
Calories per 10 g protein
655kcal
929kcal
N/A
Weight per 100 calories
76g
17g
N/A
Unsaturated / Saturated Fat ratio
3.9
7.3
N/A
Net carbs
27.76g
33.5g
N/A
Sodium
27mg
38mg
0%
Vitamin A
1µg
0µg
0%
Tryptophan
0.022mg
0.069mg
0%
Threonine
0.071mg
0.221mg
0%
Isoleucine
0.079mg
0.245mg
0%
Leucine
0.118mg
0.367mg
0%
Lysine
0.118mg
0.367mg
0%
Methionine
0.047mg
0.146mg
0%
Phenylalanine
0.084mg
0.262mg
0%
Valine
0.112mg
0.346mg
0%
Histidine
0.055mg
0.172mg
0%
Macronutrient Comparison
Macronutrient breakdown side-by-side comparison
1
2%
28%
68%
Protein:
2 g
Fats:
1.38 g
Carbs:
27.76 g
Water:
68.15 g
Other:
0.71 g
4
6%
50%
34%
7%
4%
Protein:
6.2 g
Fats:
50 g
Carbs:
33.5 g
Water:
6.6 g
Other:
3.7 g
Contains
more
Water Water
+932.6%
Contains
more
Protein Protein
+210%
Contains
more
Fats Fats
+3523.2%
Contains
more
Carbs Carbs
+20.7%
Contains
more
Other Other
+421.1%
Fat Type Comparison
Fat type breakdown side-by-side comparison
1
20%
37%
43%
Saturated fat:
Sat. Fat
0.26 g
Monounsaturated fat:
Mono. Fat
0.476 g
Polyunsaturated fat:
Poly. Fat
0.545 g
2
12%
46%
42%
Saturated fat:
Sat. Fat
5.719 g
Monounsaturated fat:
Mono. Fat
21.892 g
Polyunsaturated fat:
Poly. Fat
20.089 g
Contains
less
Sat. Fat Saturated fat
-95.5%
Contains
more
Mono. Fat Monounsaturated fat
+4499.2%
Contains
more
Poly. Fat Polyunsaturated fat
+3586.1%