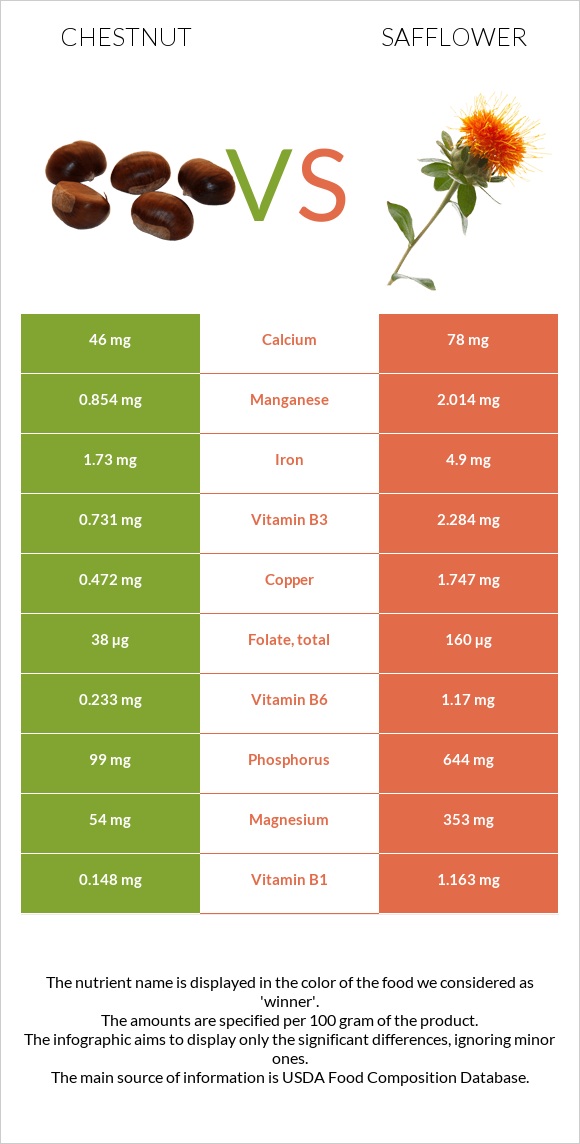
Important differences between chestnut and safflower Safflower has more copper, vitamin B1, phosphorus, vitamin B5, vitamin B6, magnesium, manganese, zinc, iron, and folate than chestnut. Safflower's daily need coverage for copper is 142% more. The food varieties used in the comparison are Nuts, chestnuts, european, boiled, and steamed and Seeds, safflower seed kernels, dried .
Infographic
Mineral Comparison
Mineral comparison score is based on the number of minerals by which one or the other food is richer. The "coverage" charts below show how much of the daily needs can be covered by 300 grams of the food.
0
100 g
300 g
1 oz - 28.35g
Magnesium
Magnesium
Calcium
Calcium
Potassium
Potassium
Iron
Iron
Copper
Copper
Zinc
Zinc
Phosphorus
Phosphorus
Sodium
Sodium
Manganese
Manganese
Selenium
Selenium
39%
14%
63%
65%
157%
6.8%
42%
3.5%
111%
0%
8
100 g
300 g
1 oz - 28.35g
Magnesium
Magnesium
Calcium
Calcium
Potassium
Potassium
Iron
Iron
Copper
Copper
Zinc
Zinc
Phosphorus
Phosphorus
Sodium
Sodium
Manganese
Manganese
Selenium
Selenium
252%
23%
61%
184%
582%
138%
276%
0.39%
263%
0%
Vitamin Comparison
Vitamin comparison score is based on the number of vitamins by which one or the other food is richer. The "coverage" charts below show how much of the daily needs can be covered by 300 grams of the food.
1
100 g
300 g
1 oz - 28.35g
Vitamin C
Vit. C
Vitamin D
Vit. D
Vitamin A
Vit. A
Vitamin E
Vit. E
Vitamin B1
Vit. B1
Vitamin B2
Vit. B2
Vitamin B3
Vit. B3
Vitamin B5
Vit. B5
Vitamin B6
Vit. B6
Vitamin B12
Vit. B12
Vitamin K
Vit. K
Folate
Folate
89%
0%
0.33%
0%
37%
24%
14%
19%
54%
0%
0%
29%
7
100 g
300 g
1 oz - 28.35g
Vitamin C
Vit. C
Vitamin D
Vit. D
Vitamin A
Vit. A
Vitamin E
Vit. E
Vitamin B1
Vit. B1
Vitamin B2
Vit. B2
Vitamin B3
Vit. B3
Vitamin B5
Vit. B5
Vitamin B6
Vit. B6
Vitamin B12
Vit. B12
Vitamin K
Vit. K
Folate
Folate
0%
0%
1%
0%
291%
96%
43%
242%
270%
0%
0%
120%
All nutrients comparison - raw data values
Nutrient
DV% diff.
Polyunsaturated fat
0.545g
28.223g
185%
Copper
0.472mg
1.747mg
142%
Vitamin B1
0.148mg
1.163mg
85%
Phosphorus
99mg
644mg
78%
Vitamin B5
0.316mg
4.03mg
74%
Vitamin B6
0.233mg
1.17mg
72%
Magnesium
54mg
353mg
71%
Fats
1.38g
38.45g
57%
Manganese
0.854mg
2.014mg
50%
Zinc
0.25mg
5.05mg
44%
Iron
1.73mg
4.9mg
40%
Folate
38µg
160µg
31%
Vitamin C
26.7mg
0mg
30%
Protein
2g
16.18g
28%
Vitamin B2
0.104mg
0.415mg
24%
Calories
131kcal
517kcal
19%
Saturated fat
0.26g
3.682g
16%
Monounsaturated fat
0.476g
4.848g
11%
Vitamin B3
0.731mg
2.284mg
10%
Calcium
46mg
78mg
3%
Carbs
27.76g
34.29g
2%
Potassium
715mg
687mg
1%
Sodium
27mg
3mg
1%
Protein per 100 calories
1.5g
3.1g
N/A
Calories per 10 g protein
655kcal
320kcal
N/A
Weight per 100 calories
76g
19g
N/A
Unsaturated / Saturated Fat ratio
3.9
9
N/A
Net carbs
27.76g
34.29g
N/A
Vitamin A
1µg
3µg
0%
Tryptophan
0.022mg
0.183mg
0%
Threonine
0.071mg
0.586mg
0%
Isoleucine
0.079mg
0.717mg
0%
Leucine
0.118mg
1.154mg
0%
Lysine
0.118mg
0.534mg
0%
Methionine
0.047mg
0.284mg
0%
Phenylalanine
0.084mg
0.806mg
0%
Valine
0.112mg
1.025mg
0%
Histidine
0.055mg
0.452mg
0%
Macronutrient Comparison
Macronutrient breakdown side-by-side comparison
1
2%
28%
68%
Protein:
2 g
Fats:
1.38 g
Carbs:
27.76 g
Water:
68.15 g
Other:
0.71 g
4
16%
38%
34%
6%
5%
Protein:
16.18 g
Fats:
38.45 g
Carbs:
34.29 g
Water:
5.62 g
Other:
5.46 g
Contains
more
Water Water
+1112.6%
Contains
more
Protein Protein
+709%
Contains
more
Fats Fats
+2686.2%
Contains
more
Carbs Carbs
+23.5%
Contains
more
Other Other
+669%
Fat Type Comparison
Fat type breakdown side-by-side comparison
1
20%
37%
43%
Saturated fat:
Sat. Fat
0.26 g
Monounsaturated fat:
Mono. Fat
0.476 g
Polyunsaturated fat:
Poly. Fat
0.545 g
2
10%
13%
77%
Saturated fat:
Sat. Fat
3.682 g
Monounsaturated fat:
Mono. Fat
4.848 g
Polyunsaturated fat:
Poly. Fat
28.223 g
Contains
less
Sat. Fat Saturated fat
-92.9%
Contains
more
Mono. Fat Monounsaturated fat
+918.5%
Contains
more
Poly. Fat Polyunsaturated fat
+5078.5%