Chicken fingers vs. Burger King Whopper — In-Depth Nutrition Comparison
Compare
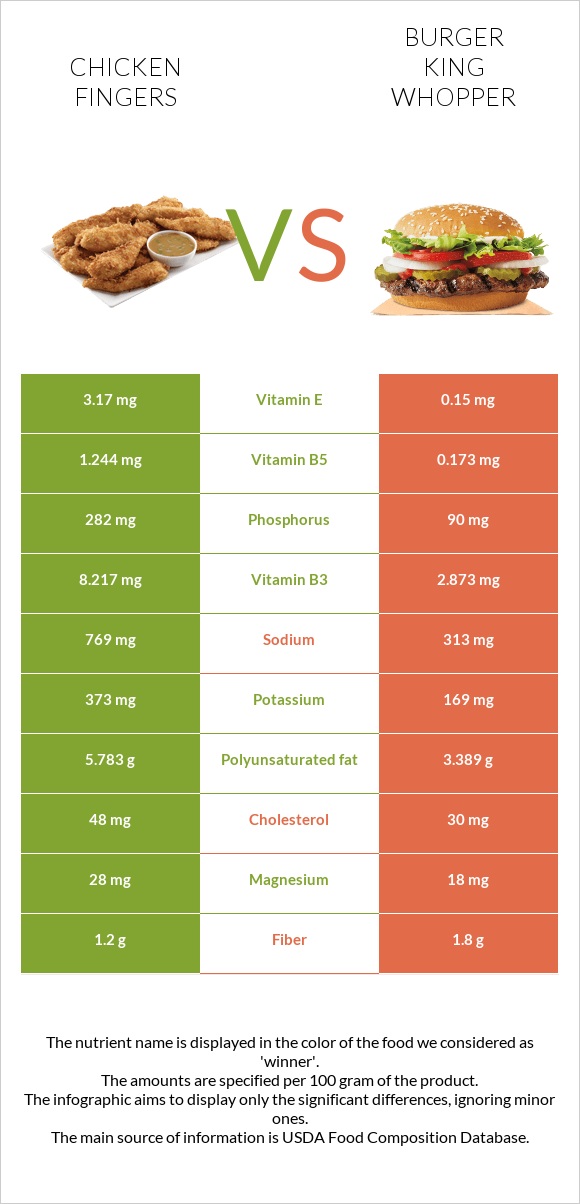
Summary of differences between chicken fingers and Burger King Whopper
- Chicken fingers have more vitamin B3, phosphorus, vitamin B6, vitamin B5, and vitamin E, while Burger King Whopper has more iron, zinc, and vitamin K.
- Burger King Whopper covers your daily need for iron, 46% more than chicken fingers.
- Chicken fingers contain 21 times more vitamin E than Burger King Whopper. While chicken fingers contain 3.17mg of vitamin E, Burger King Whopper contains only 0.15mg.
- The amount of sodium in Burger King Whopper is lower.
- Chicken fingers have a lower glycemic index. The glycemic index of chicken fingers is 46, while the glycemic index of Burger King Whopper is 61.
These are the specific foods used in this comparison Fast foods, chicken tenders and BURGER KING, WHOPPER, no cheese.
Infographic
Infographic link
Mineral Comparison
Mineral comparison score is based on the number of minerals by which one or the other food is richer. The "coverage" charts below show how much of the daily needs can be covered by 300 grams of the food.
| Contains more MagnesiumMagnesium | +55.6% |
| Contains more PotassiumPotassium | +120.7% |
| Contains more CopperCopper | +430.8% |
| Contains more PhosphorusPhosphorus | +213.3% |
| Contains more ManganeseManganese | +26.7% |
| Contains more CalciumCalcium | +129.4% |
| Contains more IronIron | +498.6% |
| Contains more ZincZinc | +298.6% |
| Contains less SodiumSodium | -59.3% |
Vitamin Comparison
Vitamin comparison score is based on the number of vitamins by which one or the other food is richer. The "coverage" charts below show how much of the daily needs can be covered by 300 grams of the food.
| Contains more Vitamin CVitamin C | +450% |
| Contains more Vitamin DVitamin D | +∞% |
| Contains more Vitamin AVitamin A | +∞% |
| Contains more Vitamin EVitamin E | +2013.3% |
| Contains more Vitamin B3Vitamin B3 | +186% |
| Contains more Vitamin B5Vitamin B5 | +619.1% |
| Contains more Vitamin B6Vitamin B6 | +368.1% |
| Contains more Vitamin B12Vitamin B12 | +∞% |
| Contains more Vitamin B1Vitamin B1 | +95.5% |
| Contains more Vitamin KVitamin K | +143.8% |
| Contains more FolateFolate | +147.4% |
All nutrients comparison - raw data values
| Nutrient |  |
 |
DV% diff. |
| Iron | 0.73mg | 4.37mg | 46% |
| Vitamin B3 | 8.217mg | 2.873mg | 33% |
| Phosphorus | 282mg | 90mg | 27% |
| Vitamin B6 | 0.426mg | 0.091mg | 26% |
| Vitamin B5 | 1.244mg | 0.173mg | 21% |
| Sodium | 769mg | 313mg | 20% |
| Vitamin E | 3.17mg | 0.15mg | 20% |
| Zinc | 0.71mg | 2.83mg | 19% |
| Protein | 19.22g | 10.74g | 17% |
| Polyunsaturated fat | 5.783g | 3.389g | 16% |
| Vitamin K | 8µg | 19.5µg | 10% |
| Vitamin B1 | 0.11mg | 0.215mg | 9% |
| Choline | 43.7mg | 8% | |
| Saturated fat | 2.493g | 4.25g | 8% |
| Vitamin B12 | 0.16µg | 7% | |
| Folate | 19µg | 47µg | 7% |
| Cholesterol | 48mg | 30mg | 6% |
| Potassium | 373mg | 169mg | 6% |
| Copper | 0.069mg | 0.013mg | 6% |
| Calories | 271kcal | 233kcal | 2% |
| Fats | 13.95g | 12.84g | 2% |
| Magnesium | 28mg | 18mg | 2% |
| Calcium | 17mg | 39mg | 2% |
| Fiber | 1.2g | 1.8g | 2% |
| Manganese | 0.228mg | 0.18mg | 2% |
| Fructose | 0g | 1.73g | 2% |
| Vitamin C | 1.1mg | 0.2mg | 1% |
| Vitamin D* | 7 IU | 1% | |
| Vitamin D | 0.2µg | 1% | |
| Starch | 17.03g | 13.53g | 1% |
| Selenium | 17.5µg | 18.2µg | 1% |
| Protein per 100 calories | 7.1g | 4.6g | N/A |
| Calories per 10 g protein | 141kcal | 217kcal | N/A |
| Weight per 100 calories | 37g | 43g | N/A |
| Unsaturated / Saturated Fat ratio | 4.3 | 1.9 | N/A |
| Net carbs | 16.05g | 16.75g | N/A |
| Carbs | 17.25g | 18.55g | 0% |
| Sugar | 0.4g | 4.22g | N/A |
| Vitamin A | 3µg | 0% | |
| Vitamin B2 | 0.179mg | 0.175mg | 0% |
| Trans fat | 0.052g | 0.507g | N/A |
| Monounsaturated fat | 4.83g | 4.685g | 0% |
| Tryptophan | 0.222mg | 0.07mg | 0% |
| Threonine | 0.803mg | 0.374mg | 0% |
| Isoleucine | 0.845mg | 0.345mg | 0% |
| Leucine | 1.553mg | 0.762mg | 0% |
| Lysine | 1.616mg | 0.593mg | 0% |
| Methionine | 0.518mg | 0.208mg | 0% |
| Phenylalanine | 1.437mg | 0.461mg | 0% |
| Valine | 0.908mg | 0.416mg | 0% |
| Histidine | 0.655mg | 0.253mg | 0% |
| Omega-3 - DHA | 0.002g | 0g | N/A |
| Omega-3 - ALA | 0.211g | 0.275g | N/A |
| Omega-3 - DPA | 0.003g | 0g | N/A |
| Omega-6 - Gamma-linoleic acid | 0.015g | 0g | N/A |
| Omega-6 - Dihomo-gamma-linoleic acid | 0.008g | N/A | |
| Omega-6 - Eicosadienoic acid | 0.007g | 0.002g | N/A |
| Omega-6 - Linoleic acid | 5.439g | 2.757g | N/A |
Macronutrient Comparison
Macronutrient breakdown side-by-side comparison
Protein:
19.22 g
Fats:
13.95 g
Carbs:
17.25 g
Water:
46.64 g
Other:
2.94 g
Protein:
10.74 g
Fats:
12.84 g
Carbs:
18.55 g
Water:
56.43 g
Other:
1.44 g
| Contains more ProteinProtein | +79% |
| Contains more OtherOther | +104.2% |
| Contains more WaterWater | +21% |
~equal in
Fats
~12.84g
~equal in
Carbs
~18.55g
Fat Type Comparison
Fat type breakdown side-by-side comparison
Saturated fat:
Sat. Fat
2.493 g
Monounsaturated fat:
Mono. Fat
4.83 g
Polyunsaturated fat:
Poly. Fat
5.783 g
Saturated fat:
Sat. Fat
4.25 g
Monounsaturated fat:
Mono. Fat
4.685 g
Polyunsaturated fat:
Poly. Fat
3.389 g
| Contains less Sat. FatSaturated fat | -41.3% |
| Contains more Poly. FatPolyunsaturated fat | +70.6% |
~equal in
Monounsaturated fat
~4.685g
Carbohydrate type comparison
Carbohydrate type breakdown side-by-side comparison
Starch:
17.03 g
Sucrose:
0.4 g
Glucose:
0 g
Fructose:
0 g
Lactose:
0 g
Maltose:
0 g
Galactose:
0 g
Starch:
13.53 g
Sucrose:
1.7 g
Glucose:
0 g
Fructose:
1.73 g
Lactose:
0 g
Maltose:
0.67 g
Galactose:
0.11 g
| Contains more StarchStarch | +25.9% |
| Contains more SucroseSucrose | +325% |
| Contains more FructoseFructose | +∞% |
| Contains more MaltoseMaltose | +∞% |
| Contains more GalactoseGalactose | +∞% |
~equal in
Glucose
~0g
~equal in
Lactose
~0g


