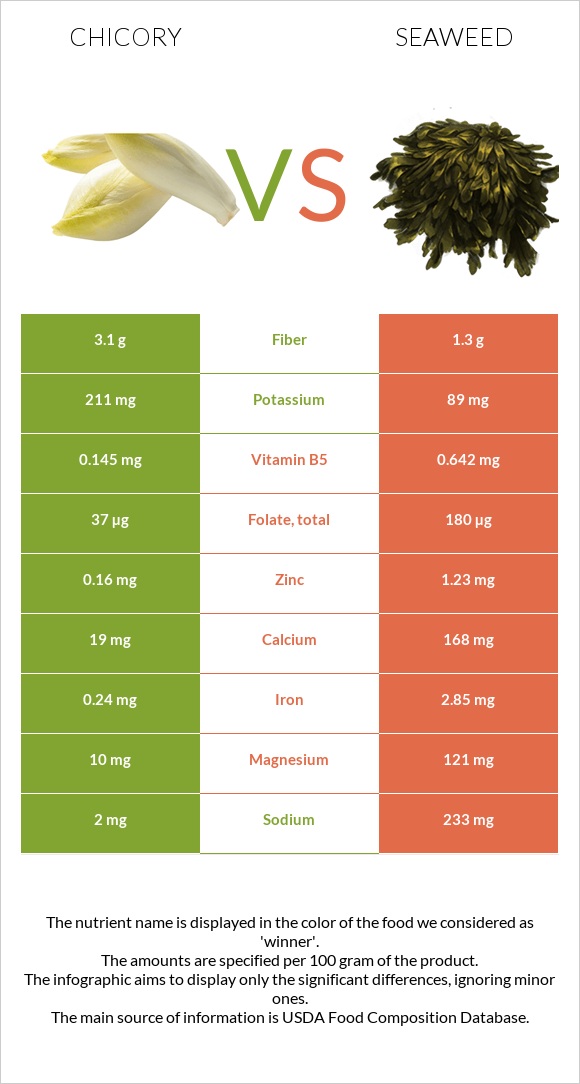
What are the main differences between chicory and seaweed? Chicory is richer in fiber, yet seaweed is richer in folate, iron, magnesium, calcium, vitamin B5, zinc, vitamin B2, and copper. Seaweed's daily need coverage for folate is 36% higher. Chicory has 2 times more fiber than seaweed. Chicory has 3.1g of fiber, while seaweed has 1.3g. Chicory contains less sodium. We used Chicory, witloof, raw and Seaweed, kelp, raw types in this comparison.
Infographic
Mineral Comparison
Mineral comparison score is based on the number of minerals by which one or the other food is richer. The "coverage" charts below show how much of the daily needs can be covered by 300 grams of the food.
2
100 g
300 g
0.5 cup - 45g 1 head - 53g
Magnesium
Magnesium
Calcium
Calcium
Potassium
Potassium
Iron
Iron
Copper
Copper
Zinc
Zinc
Phosphorus
Phosphorus
Sodium
Sodium
Manganese
Manganese
Selenium
Selenium
7.1%
5.7%
19%
9%
17%
4.4%
11%
0.26%
13%
1.1%
8
100 g
300 g
2 tbsp (1/8 cup) - 10g
Magnesium
Magnesium
Calcium
Calcium
Potassium
Potassium
Iron
Iron
Copper
Copper
Zinc
Zinc
Phosphorus
Phosphorus
Sodium
Sodium
Manganese
Manganese
Selenium
Selenium
86%
50%
7.9%
107%
43%
34%
18%
30%
26%
3.8%
Vitamin Comparison
Vitamin comparison score is based on the number of vitamins by which one or the other food is richer. The "coverage" charts below show how much of the daily needs can be covered by 300 grams of the food.
2
100 g
300 g
0.5 cup - 45g 1 head - 53g
Vitamin C
Vit. C
Vitamin D
Vit. D
Vitamin A
Vit. A
Vitamin E
Vit. E
Vitamin B1
Vit. B1
Vitamin B2
Vit. B2
Vitamin B3
Vit. B3
Vitamin B5
Vit. B5
Vitamin B6
Vit. B6
Vitamin B12
Vit. B12
Vitamin K
Vit. K
Folate
Folate
9.3%
0%
0.33%
0%
16%
6.2%
3%
8.7%
9.7%
0%
0%
28%
7
100 g
300 g
2 tbsp (1/8 cup) - 10g
Vitamin C
Vit. C
Vitamin D
Vit. D
Vitamin A
Vit. A
Vitamin E
Vit. E
Vitamin B1
Vit. B1
Vitamin B2
Vit. B2
Vitamin B3
Vit. B3
Vitamin B5
Vit. B5
Vitamin B6
Vit. B6
Vitamin B12
Vit. B12
Vitamin K
Vit. K
Folate
Folate
10%
0%
2%
17%
13%
35%
8.8%
39%
0.46%
0%
165%
135%
All nutrients comparison - raw data values
Nutrient
DV% diff.
Vitamin K
66µg
55%
Folate
37µg
180µg
36%
Iron
0.24mg
2.85mg
33%
Magnesium
10mg
121mg
26%
Calcium
19mg
168mg
15%
Zinc
0.16mg
1.23mg
10%
Sodium
2mg
233mg
10%
Vitamin B5
0.145mg
0.642mg
10%
Copper
0.051mg
0.13mg
9%
Vitamin B2
0.027mg
0.15mg
9%
Fiber
3.1g
1.3g
7%
Vitamin E
0.87mg
6%
Potassium
211mg
89mg
4%
Manganese
0.1mg
0.2mg
4%
Vitamin B6
0.042mg
0.002mg
3%
Protein
0.9g
1.68g
2%
Carbs
4g
9.57g
2%
Phosphorus
26mg
42mg
2%
Vitamin B3
0.16mg
0.47mg
2%
Choline
12.8mg
2%
Calories
17kcal
43kcal
1%
Fats
0.1g
0.56g
1%
Vitamin A
1µg
6µg
1%
Selenium
0.2µg
0.7µg
1%
Vitamin B1
0.062mg
0.05mg
1%
Saturated fat
0.024g
0.247g
1%
Protein per 100 calories
5.3g
3.9g
N/A
Calories per 10 g protein
189kcal
256kcal
N/A
Weight per 100 calories
588g
233g
N/A
Vitamin C
2.8mg
3mg
0%
Net carbs
0.9g
8.27g
N/A
Sugar
0.6g
N/A
Monounsaturated fat
0.002g
0.098g
0%
Polyunsaturated fat
0.044g
0.047g
0%
Tryptophan
0.016mg
0.048mg
0%
Threonine
0.025mg
0.055mg
0%
Isoleucine
0.054mg
0.076mg
0%
Leucine
0.039mg
0.083mg
0%
Lysine
0.035mg
0.082mg
0%
Methionine
0.005mg
0.025mg
0%
Phenylalanine
0.022mg
0.043mg
0%
Valine
0.041mg
0.072mg
0%
Histidine
0.015mg
0.024mg
0%
Omega-3 - EPA
0.004g
N/A
Macronutrient Comparison
Macronutrient breakdown side-by-side comparison
1
4%
95%
Protein:
0.9 g
Fats:
0.1 g
Carbs:
4 g
Water:
94.52 g
Other:
0.48 g
4
2%
10%
82%
7%
Protein:
1.68 g
Fats:
0.56 g
Carbs:
9.57 g
Water:
81.58 g
Other:
6.61 g
Contains
more
Water Water
+15.9%
Contains
more
Protein Protein
+86.7%
Contains
more
Fats Fats
+460%
Contains
more
Carbs Carbs
+139.3%
Contains
more
Other Other
+1277.1%
Fat Type Comparison
Fat type breakdown side-by-side comparison
1
34%
3%
63%
Saturated fat:
Sat. Fat
0.024 g
Monounsaturated fat:
Mono. Fat
0.002 g
Polyunsaturated fat:
Poly. Fat
0.044 g
2
63%
25%
12%
Saturated fat:
Sat. Fat
0.247 g
Monounsaturated fat:
Mono. Fat
0.098 g
Polyunsaturated fat:
Poly. Fat
0.047 g
Contains
less
Sat. Fat Saturated fat
-90.3%
Contains
more
Mono. Fat Monounsaturated fat
+4800%
~equal in
Polyunsaturated fat
~0.047g